Ask Your Question
2

using sage functions with data from octave

asked 13 years ago

jamlatino gravatar image

updated 4 years ago

FrédéricC gravatar image

Hello, I´m trying to construct a histogram using octave within sage, but I don´t know how to use sage functions with data that comes from octave, here´s what I´m doing:

a = octave.normrnd(50,3,100,1) #this generates a column vector with normal random data
b = octave.hist(a) #this generates a histogram from the previous data

bar_chart(b)  # this is where I get the following error:

NotImplementedError: Unable to parse output

Is this something that has not been implemented as the message suggests or am I doing something wrong?

Preview: (hide)

Comments

Did you mean `b = octave_hist(a)`?

Juanlu001 gravatar imageJuanlu001 ( 13 years ago )

Good question, though. I tried `b.sage()`, but also raised a NotImplementedError

Juanlu001 gravatar imageJuanlu001 ( 13 years ago )

1 Answer

Sort by » oldest newest most voted
1

answered 4 years ago

dsejas gravatar image

updated 4 years ago

Hello, @jamlatino! I had success with the following code:

a = octave.normrnd(50,3,100,1)
b = octave.hist(a)

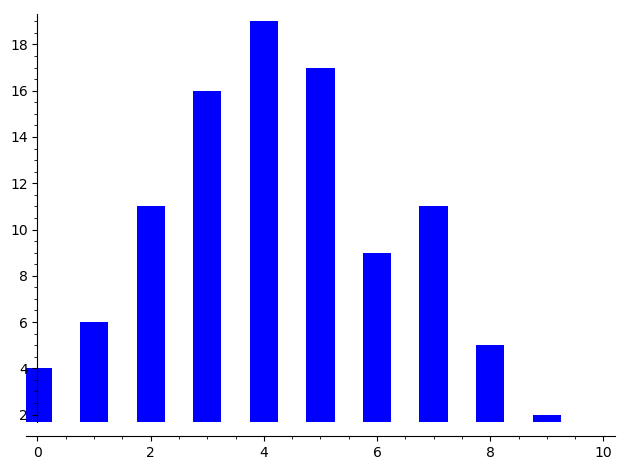
bar_chart(b.sage()) # first convert the Octave object into a Sage object, and then plot

The idea behind this code is simple: When you create an Octave object, you cannot operate it with pure-Sage functions, so you have to transform the object to Sage representation first. That is what the sage() method does.

This is what I get in a particular run:

image description

(Other software interfaces Sage defines, like maxima, GAP, etc. should have a sage() method too, for this same purpose.)

I hope this helps!

Preview: (hide)
link

Your Answer

Please start posting anonymously - your entry will be published after you log in or create a new account.

Add Answer

Question Tools

Stats

Asked: 13 years ago

Seen: 510 times

Last updated: May 24 '20