plotting graphs, vertices on some graphs are very small
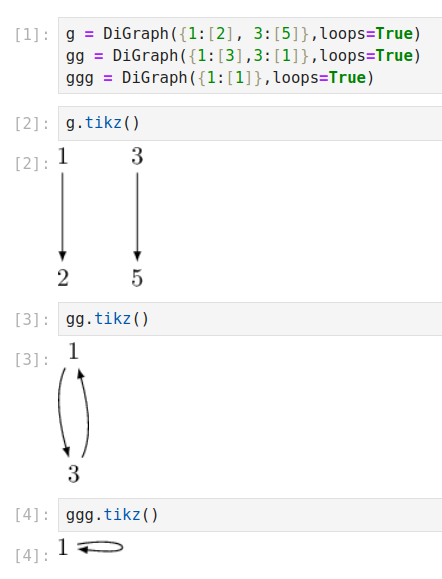
I am plotting digraphs. I have raised the vertex size way more than I want to because I can barely see the vertices if: 1. the digraph has at least one set of vertices with an directed edge going both ways or 2. the digraph has loops. otherwise, they print with the vertex size I am specifying. Here's an example of the two types of graphs with small vertices and one with correct size:
g = DiGraph({1:[2], 3:[5]},loops=True)
gg = DiGraph({1:[3],3:[1]},loops=True)
ggg = DiGraph({1:[1]},loops=True)

plots = []
plots.append(gg.plot(layout='circular', vertex_size=600, vertex_labels=True, xmin = -2, xmax = 2, loop_size=.3))
plots.append(g.plot(layout='circular', vertex_size=600, vertex_labels=True, xmin = -2, xmax = 2, loop_size=.3))
plots.append(ggg.plot(layout='circular', vertex_size=600, vertex_labels=True, xmin = -2, xmax = 2, loop_size=.3))

graphics_array(plots).show()
Thanks for your help.

These graphs looks fine when I look at them separately, so it looks more like an issue with
graphics_arraythan the individual plots. Can you confirm?Also, what happens if you remove/modify the
xminandxmaxarguments? Can you get the pictures you want?Thanks John. I am not convinced that the issue is with graphics_array alone. They seem a lot more uniformly sized when displayed separately but look again because the vertices on the first and third graphs are still ever so slightly smaller than the middle graph.
If I remove xmin,xmax, they are even more differently sized but with the two outer graphs having larger vertices compared to middle. If I make them have the same amount of vertices, and also remove the xmin,xmax, it helps a bit, (which probably depends more on the vertex positions than the amount of vertices being the same, I imagine..).
here's more code to show the updates mentioned in previous comment.