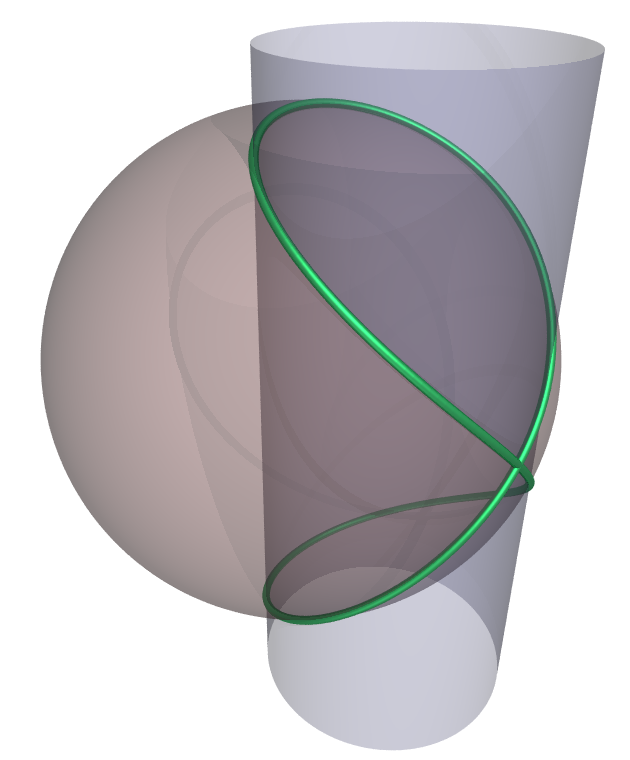
Ask Your Question
2

Viviani's Curve

asked 2011-05-19 12:18:07 +0200

Alexxx gravatar image

updated 2017-01-08 12:08:45 +0200

FrédéricC gravatar image

Hello! How can I plot Viviani's curve in Sage onto cylinder and sphere? My problem is putting sphere into or inside cylinder and then put Viviani's Curve on this.

here is example http://upload.wikimedia.org/wikipedia/commons/0/05/Viviani_curve.png

edit retag flag offensive close merge delete

3 Answers

Sort by » oldest newest most voted
5

answered 2011-05-19 16:23:41 +0200

Kelvin Li gravatar image

Here is a full working example that semi-resembles the original example on Wikipedia:

var('u v')

sph_obj = parametric_plot3d(
    (sin(u)*cos(v), sin(u)*sin(v), cos(u)),
    (v, 0, 2*pi),
    (u, 0, 2*pi),
    opacity=0.3,
    color=(0.2, 0.1, 0.1),
)

cyl_obj = parametric_plot3d(
    (sin(v)/2, cos(v)/2 + 1/2, u),
    (v, 0, 2*pi),
    (u, -3/2, 3/2),
    opacity=0.7,
    color=(0.2, 0.2, 0.3),
    plot_points=(80, 3)
)

v_curve_obj = parametric_plot3d(
    (sin(v)*cos(v), sin(v)*sin(v), cos(v)),
    (v, 0, 2*pi),
    color="green",
    thickness=2,
)

(sph_obj + cyl_obj + v_curve_obj).rotateZ(3/2).show(
    viewer="tachyon",
    aspect_ratio=1,
    frame=False,
    zoom=1.3
)

image description

edit flag offensive delete link more

Comments

1

very nice!

niles gravatar imageniles ( 2011-05-19 16:27:48 +0200 )edit

Huh, I didn't know one could attach images.

kcrisman gravatar imagekcrisman ( 2011-05-20 21:50:23 +0200 )edit
0

answered 2011-05-19 12:47:21 +0200

Alexxx gravatar image

updated 2011-05-19 13:33:38 +0200

kcrisman gravatar image

Thank you for quick answer! But still we have a problem with plotting. We have this equasions: for sphere:

parametric_plot3d((sin(u)*cos(v),sin(u)*sin(v),cos(u)),(v,0,2*pi),(u,0,2*pi))

for cylinder:

parametric_plot3d((sin(v),cos(v),u),(v,0,2*pi),(u,0,2*pi))

and viviani's curve:

parametric_plot3d((sin(v)*cos(v),sin(v)*sin(v),cos(v)),(v,0,2*pi))

and now we don't know how to put it all together. :(

edit flag offensive delete link more

Comments

1

You can just add them! Notice how Niles does S+C. So literally putting + in between should work.

kcrisman gravatar imagekcrisman ( 2011-05-19 13:35:21 +0200 )edit

By the way, I recommend that you make your cylinder a lot shorter, like let u go between 0 and 1. Also, if you add the keywords thickness=4 and color='red' to your curve, it will show up better.

kcrisman gravatar imagekcrisman ( 2011-05-19 13:36:42 +0200 )edit

Finally, your cylinder is too thick! You'll need to have it centered elsewhere to have it line up with the curve. But that's just math, not Sage :)

kcrisman gravatar imagekcrisman ( 2011-05-19 13:37:35 +0200 )edit
0

answered 2011-05-19 12:32:31 +0200

niles gravatar image

If you have a parametrization of the curve, then parametric_plot3d will probably be the best way to plot the curve. Spheres and cylinders are easy to plot -- here is one example:

S = sphere((0,1,2),2,opacity=.6)

theta,z=var('theta,z')
C = cylindrical_plot3d(2,(theta,0,4*pi/2),(z,-2,2),opacity=.5,color='red')

(S+C).show(aspect_ratio=1)
edit flag offensive delete link more

Your Answer

Please start posting anonymously - your entry will be published after you log in or create a new account.

Add Answer

Question Tools

Stats

Asked: 2011-05-19 12:18:07 +0200

Seen: 1,053 times

Last updated: May 19 '11