How to specify dashed edges in SageMath?
I would like to present some subgraphs of a graph. Considering that the printed version is in black and white, I would like the highlighted subgraphs to appear as red dashed lines. However, I have only seen settings for color. I am not sure how to set the dashed lines.
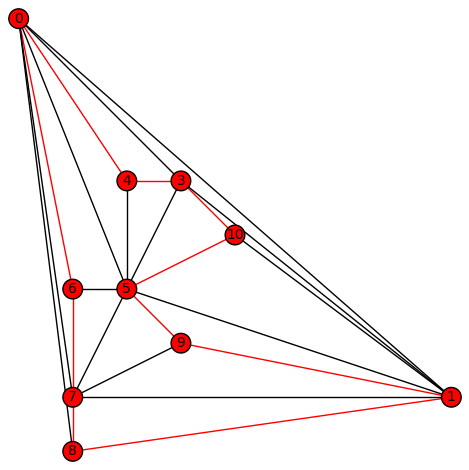
g=Graph([(0, 1), (0, 3), (0, 4), (0, 5), (0, 6), (0, 7), (0, 8), (1, 3), (1, 5), (1, 7), (1, 8), (1, 9), (1, 10),
       (3, 4), (3, 5), (3, 10), (4, 5), (5, 6), (5, 7), (5, 9), (5, 10), (6, 7), (7, 8), (7, 9)])
g.plot(layout="planar",save_pos=True)
s=g.hamiltonian_cycle()
s1=s.edges(labels=False)
#print(s1)
def plot_with_highlight(G, highlight_edges):
    highlight_vertices = list(set().union(*highlight_edges))
    G.plot(edge_colors={'red': highlight_edges}, vertex_colors={'red': highlight_vertices}).show()
plot_with_highlight(g,s1)

Have look here
https://ask.sagemath.org/question/35638/drawing-auslander-reiten-quivers-with-sage-possible/. I rember also that you can force the vertices to a desired locations. In such a way an edge could not intersect or recover a vertexGreat, but it feels like this method isn't a modification, but rather a reconstruction of the plot.
As shown in the documentation of
g.plot, you may useedge_style='dashed'. But unfortunately, it plots every edge to be dashed.A contribution is more than welcome to make this argument take a dictionnary as input like for
edge_colorsinput.