Ask Your Question
1

plotting origin location

asked 2024-01-25 12:21:41 +0200

metanosis gravatar image

updated 2024-01-25 18:31:42 +0200

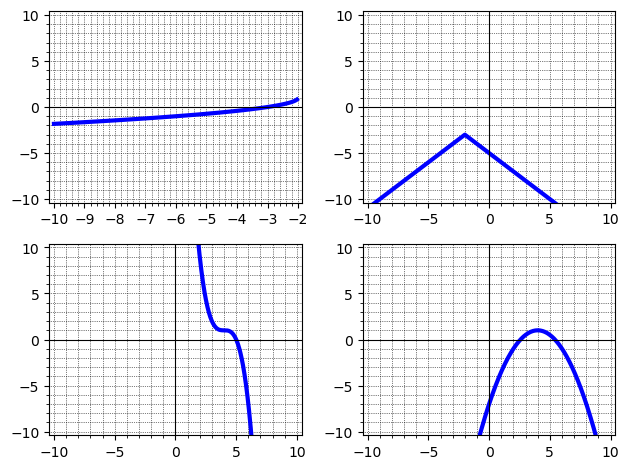
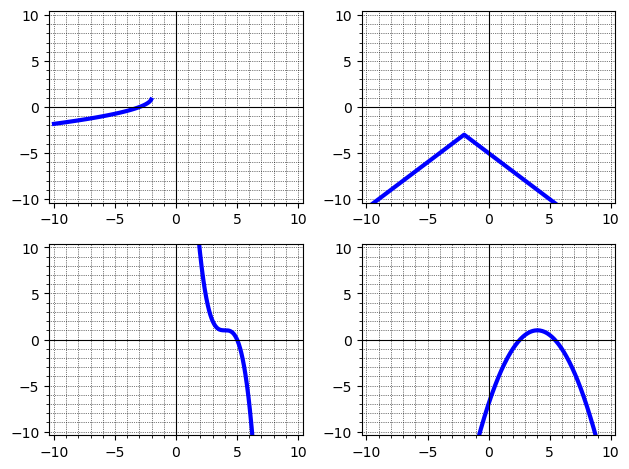
plotting some basic functions in sage, quadratic, abs value, etc. Then setting four up in an array. Problem; the square root function plots, but the frame and axes adjust so only the defined values show on the axes, and the origin and y axis are moved to the far left of the frame, not in the center, the image below will show the problem. Cannot find a way to remedy this, and plot the square root so the axes and frame stay put, i.e. centered, like the other three functions plot. Here is the code;

p1 = plot(-sqrt(-x-2)+1, (x,-10,8),xmin=-10,xmax=10,ymin=-10,ymax=10,gridlines="minor",frame=True,axes=True,figsize=(3,3),thickness='3') # the function ,followed by the domain
p2 = plot(-abs(x+2)-3, (x,-10,10),xmin=-10,xmax=10,ymin=-10,ymax=10,gridlines="minor",frame=True,figsize=(3,3),thickness='3')
p3= plot(-(x-4)^3+1, (x,-10,10),xmin=-10,xmax=10,ymin=-10,ymax=10,gridlines="minor",frame=True,figsize=(3,3),thickness='3') # the function ,followed by the domain
p4= plot(-.5*(x-4)^2+1, (x,-10,10),xmin=-10,xmax=10,ymin=-10,ymax=10,gridlines="minor",frame=True,figsize=(3,3),thickness='3') # the function ,followed by the domain
combined=myplot+myplot2
(myplot).show(title='A',frame=True,figsize=(5,5))
graphics_array(((p1,p2), (p3,p4))) # long time
Graphics Array of size 2 x 2

Here is the output; (Sorry, new user, cannot upload a file)

edit retag flag offensive close merge delete

3 Answers

Sort by ยป oldest newest most voted
1

answered 2024-01-26 03:44:06 +0200

dan_fulea gravatar image

You may want (next time) to rearrange the code, so that it gets readable. Also, respecting PEP8 and PEP40 may let the reader feel the respect.

(I have rewrite, since the answer should be readable.)

The variable myplot is not defined, so i will ignore the lines with it and the followers.

kwargs = {
    'xmin' : -10 ,
    'xmax' : +10 ,
    'ymin' : -10 ,
    'ymax' : +10 ,
    'gridlines' : 'minor' ,
    'frame' : True ,
    'axes' : True ,
    'figsize' : (3, 3) ,
    'thickness' : 3 , }

p1 = plot(-sqrt(-x - 2) + 1, (x, -10, 8), **kwargs)
p2 = plot(-abs(x + 2) - 3, (x, -10, 10), **kwargs)
p3 = plot(-(x - 4)^3 + 1, (x, -10, 10), **kwargs)
p4 = plot(-.5*(x - 4)^2 + 1, (x, -10, 10), **kwargs)

# graphics_array(((p1, p2), (p3, p4))) # long time

When this is done, sage sets some ranges for the $x$-variables, that should be relevant. For instance, the function involving the square root, $f(x)=-\sqrt{-x-2}$ is well defined as a real valued function on $[-10, -2]$, but for other values the graph is like a river in the desert, it is not reaching the ocean at the right boundary. We may ask for...

sage: p1.get_axes_range()
{'xmin': -10.0,
 'xmax': -2.035750064037735,
 'ymin': -1.8284271247461903,
 'ymax': 0.8109231266449151}
sage: p2.get_axes_range()
{'xmin': -10.0, 'xmax': 10.0, 'ymin': -15.0, 'ymax': -3.0000725445420926}
sage: p3.get_axes_range()
{'xmin': -10.0, 'xmax': 10.0, 'ymin': -215.0, 'ymax': 2745.0}
sage: p4.get_axes_range()
{'xmin': -10.0, 'xmax': 10.0, 'ymin': -97.0, 'ymax': 0.9999323671872665}

So these are the ranges of the functions, as sage considers to give a best picture for them. The function involving the cube is also leaving the box, sage gets corresponding axes range.

A plot so far is:

sage: graphics_array(((p1, p2), (p3, p4)))
Launched png viewer for Graphics Array of size 2 x 2

2x2 grid with pieces not centered

Now, if we insist to have p1 plotted within $[-10,10]^\times 2$, we have to set our own wish. We can do this in a loop:

for p in (p1, p2, p3, p4):
    p.set_axes_range(-10, 10, -10, 10)

If we ask again...

sage: p1.get_axes_range()
{'xmin': -10.0, 'xmax': 10.0, 'ymin': -10.0, 'ymax': 10.0}
sage: p2.get_axes_range()
{'xmin': -10.0, 'xmax': 10.0, 'ymin': -10.0, 'ymax': 10.0}
sage: p3.get_axes_range()
{'xmin': -10.0, 'xmax': 10.0, 'ymin': -10.0, 'ymax': 10.0}
sage: p4.get_axes_range()
{'xmin': -10.0, 'xmax': 10.0, 'ymin': -10.0, 'ymax': 10.0}

So the boxes are as we want them. And the new plot is:

2x2 grid with pieces centered

edit flag offensive delete link more
1

answered 2024-01-25 18:35:22 +0200

You can try p1.set_axes_range(-10, 10, -10, 10) (or whatever numbers you want).

edit flag offensive delete link more
0

answered 2024-01-29 12:06:12 +0200

In SageMath, when plotting the square root function, you may encounter issues with the frame and axes not staying centered like in other plots. To address this, manually set the axes_pad option to control spacing and the ticks option to specify ticks on the axes. Here's a modified snippet of your code: p1 = plot(-sqrt(-x-2)+1, (x,-10,8), gridlines="minor", frame=True, axes=True, figsize=(3,3), thickness='3', axes_pad=(0.5, 0.5), ticks=[[-10, -5, 0, 5, 10], [-10, -5, 0, 5, 10]])

Repeat for other plots...

graphics_array(((p1, p2), (p3, p4))).show(frame=True, figsize=(5,5)) Adjust the axes_pad and ticks values as needed for optimal centering and appearance of the plots.

edit flag offensive delete link more

Your Answer

Please start posting anonymously - your entry will be published after you log in or create a new account.

Add Answer

Question Tools

Stats

Asked: 2024-01-25 12:19:43 +0200

Seen: 134 times

Last updated: Jan 29