Overflow in list_plot?
The code:
l = [1.4312706585e12, -1.4575266189e12, 4.9459419278e11, -4.8146621292e12]
list_plot(l).show()
shows the next image:
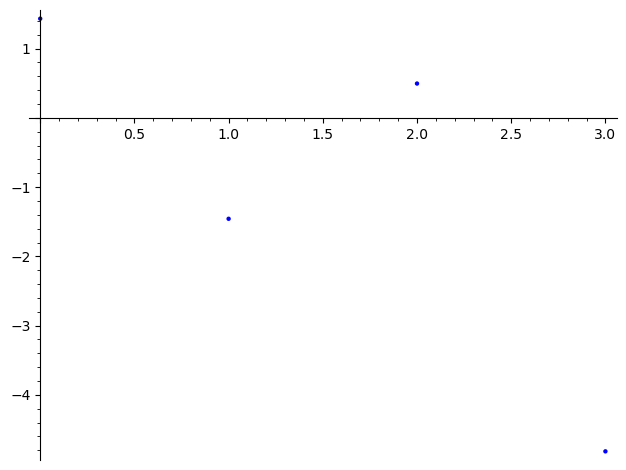
Is that an intended bebaviour?
add a comment
Use:
l = [1.4312706585e12, -1.4575266189e12, 4.9459419278e11, -4.8146621292e12]

list_plot(l,frame=True)
Asked: 2023-11-30 08:10:27 +0200
Seen: 511 times
Last updated: Nov 30 '23
 Copyright Sage, 2010. Some rights reserved under creative commons license. Content on this site is licensed under a Creative Commons Attribution Share Alike 3.0 license.