How to draw CubeGraph(5) better?
I want to find a minimum dominating set of CubeGraph(5) and display it. However, I found that the drawing of CubeGraph(5) is very poor, with overlapping vertices and intersections between vertices and edges. How can I make Sage provide a slightly better drawing?
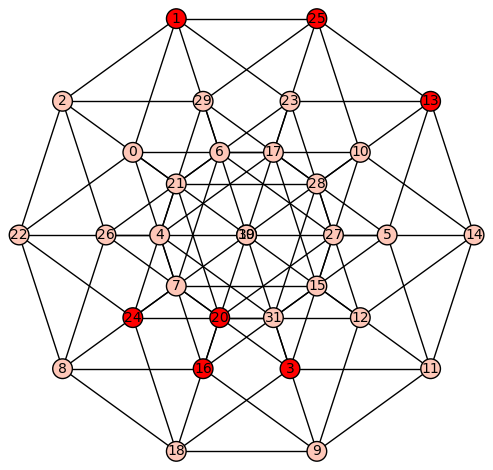
g1 = graphs.CubeGraph(5)
g1.relabel()
m=g1.dominating_set()
g1.plot(vertex_colors={"red": m})
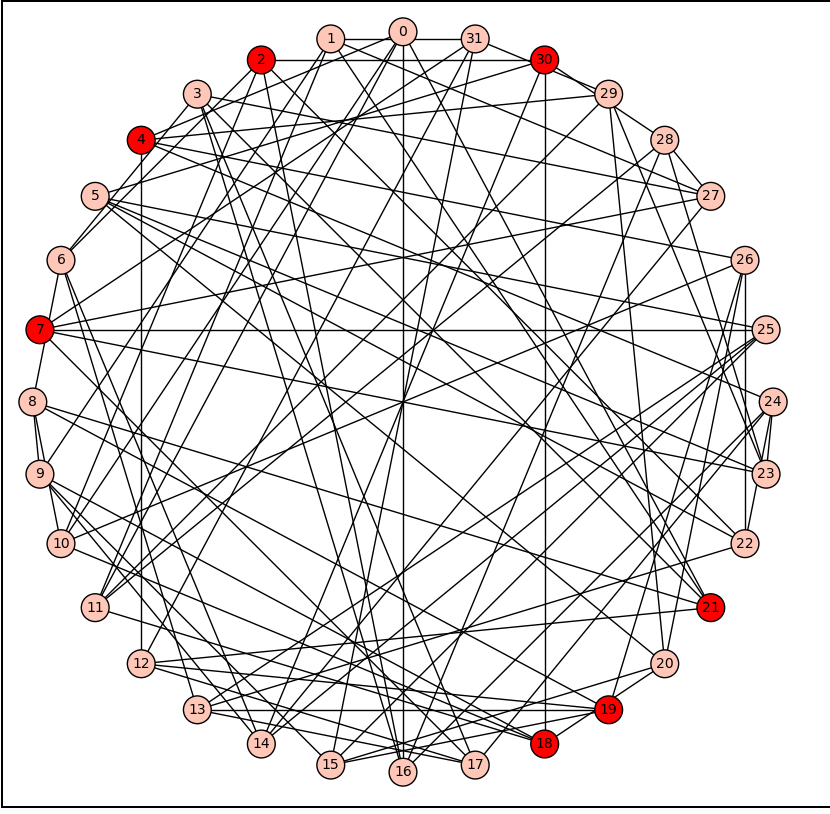
g2.to_dictionary()
{0: [1, 17, 19, 22, 7], 1: [0, 2, 6, 23, 25], 2: [1, 21, 22, 26, 29], 3: [18, 19, 7, 11, 27], 4: [16, 17, 22, 29, 31], 5: [17, 19, 11, 13, 31], 6: [1, 7, 10, 26, 27], 7: [0, 3, 6, 8, 15], 8: [16, 18, 22, 7, 26], 9: [16, 18, 11, 12, 31], 10: [6, 25, 30, 14, 15], 11: [3, 5, 9, 14, 15], 12: [20, 9, 28, 30, 14], 13: [5, 23, 25, 28, 14], 14: [10, 11, 27, 12, 13], 15: [16, 17, 7, 10, 11], 16: [4, 8, 9, 30, 15], 17: [0, 4, 5, 25, 15], 18: [3, 20, 8, 24, 9], 19: [0, 3, 5, 23, 24], 20: [18, 21, 26, 27, 12], 21: [2, 20, 23, 24, 28], 22: [0, 2, 4, 8, 24], 23: [1, 19, 21, 27, 13], 24: [18, 19, 21, 22, 31], 25: [1, 17, 10, 13, 29], 26: [2, 20, 6, 8, 30], 27: [3, 20, 6, 23, 14], 28: [21, 12, 13, 29, 31], 29: [2, 4, 25, 28, 30], 30: [16, 10, 26, 12, 29], 31: [4, 5, 24, 9, 28]}
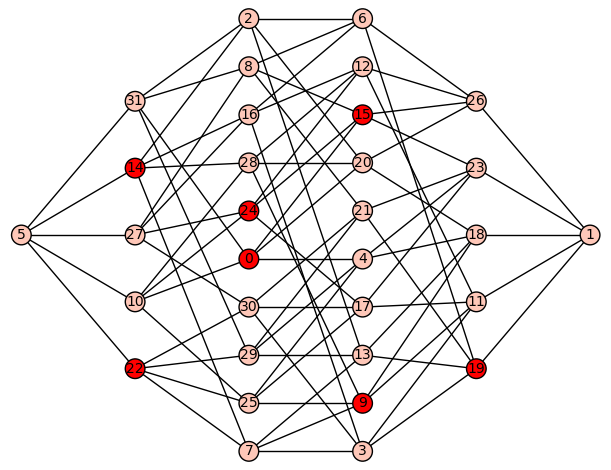

Try to add parameter
layout='spring', run a few times and see it it gives anything you like Drawing will be different each time.To remove the default vertex positions, try