Ask Your Question
1

implicit_plot doubled straight line

asked 2022-11-19 15:02:27 +0100

Tintin1 gravatar image

How come this plotted straight line is doubled?

x, y = var('x,y')
show(implicit_plot((y-x-1/2)^2,(x,-5,5),(y,-5,5), color='red'),gridlines=True)

I am looking for the zeros of the polynomial (y-x-1/2)^2. Obviously this has the same zeros as (y-x-1/2). Somehow the plot draws two parallel straight lines.

My attempt to display a plot here failed and I cannot upload any files, yet, due to a lack of points on this forum.

edit retag flag offensive close merge delete

Comments

from contour_plot??

# When there's only one level (say, zero), matplotlib doesn't
    # handle it well. If all of the data lie on one side of that
    # level -- for example, if f(x,y) >= 0 for all x,y -- then it
    # will fail to plot the points where f(x,y) == 0. This is
    # especially catastrophic for implicit_plot(), which tries to
    # do just that. Here we handle that special case: if there's
    # only one level, and if all of the data lie on one side of
    # it, we perturb the data a bit so that they don't. The resulting
    # plots don't look great, but they're not empty, which is an
    # improvement.
achrzesz gravatar imageachrzesz ( 2022-11-19 21:20:41 +0100 )edit

Ugly workaround

x, y = var('x,y')
contour_plot((y-x-1/2)^2,(x,-5,5),(y,-5,5),
fill=False,contours=[0.001],plot_points=200)
achrzesz gravatar imageachrzesz ( 2022-11-19 21:23:49 +0100 )edit

1 Answer

Sort by ยป oldest newest most voted
0

answered 2022-11-19 23:30:42 +0100

Emmanuel Charpentier gravatar image

Using implicit_plot "raw" (i. e. without wrapping in show) allows you to see the warning emitted by this function :

sage: implicit_plot((y-x-1/2)^2,(x,-5,5),(y,-5,5), color='red')
/usr/local/sage-9/src/sage/plot/contour_plot.py:988: UserWarning: pathological contour plot of a function whose values all lie on one side of the sole contour; we are adding more plot points and perturbing your function values.
  warn("pathological contour plot of a function whose "
Launched png viewer for Graphics object consisting of 1 graphics primitive
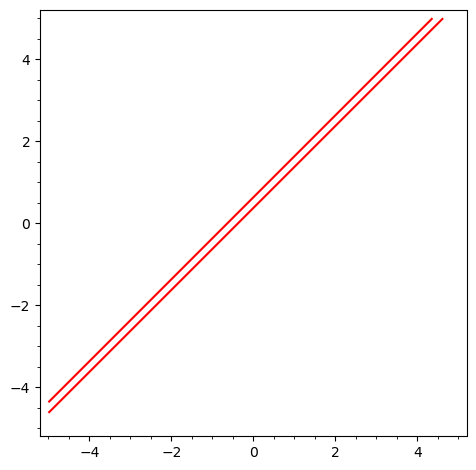
image description

wich, IMNSHO, describes exactly what happens.

Since your function is polynomial, it is tempting to plot the ideal that your polynomial defines. However, since the same implicit_plot is ultimately used, the same problem happens :

sage: R1.<u, v>=QQ[]
sage: R1.ideal((v-u-1/2)^2).plot()
/usr/local/sage-9/src/sage/plot/contour_plot.py:988: UserWarning: pathological contour plot of a function whose values all lie on one side of the sole contour; we are adding more plot points and perturbing your function values.
  warn("pathological contour plot of a function whose "
Launched png viewer for Graphics object consisting of 1 graphics primitive

Here, a bit of reflection helps. as long as $x\in\mathbb{R}$, $x^2=0\Rightarrow{}x=0$. This is also true if you substitute $y-x-\frac{1}{2}$ for $x$. Therefore,

sage: implicit_plot(y-x-1/2, (x, -5, 5), (y, -5, 5))
Launched png viewer for Graphics object consisting of 1 graphics primitive
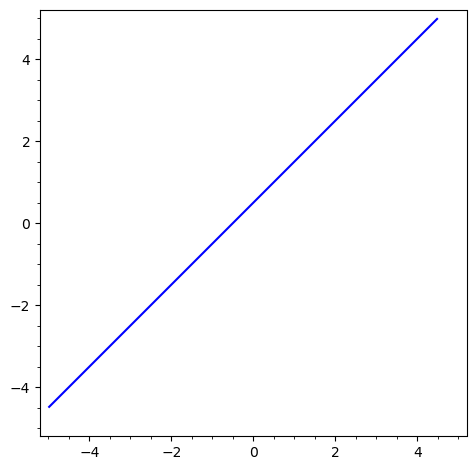
image description

suffices.

HTH,

edit flag offensive delete link more

Your Answer

Please start posting anonymously - your entry will be published after you log in or create a new account.

Add Answer

Question Tools

1 follower

Stats

Asked: 2022-11-19 15:02:27 +0100

Seen: 145 times

Last updated: Nov 19 '22