Revision history [back]
| | 1 | initial version |
Using implicit_plot "raw" (i. e. without wrapping in show) allows you to see the warning emitted by this function :
sage: implicit_plot((y-x-1/2)^2,(x,-5,5),(y,-5,5), color='red')
/usr/local/sage-9/src/sage/plot/contour_plot.py:988: UserWarning: pathological contour plot of a function whose values all lie on one side of the sole contour; we are adding more plot points and perturbing your function values.
  warn("pathological contour plot of a function whose "
Launched png viewer for Graphics object consisting of 1 graphics primitive
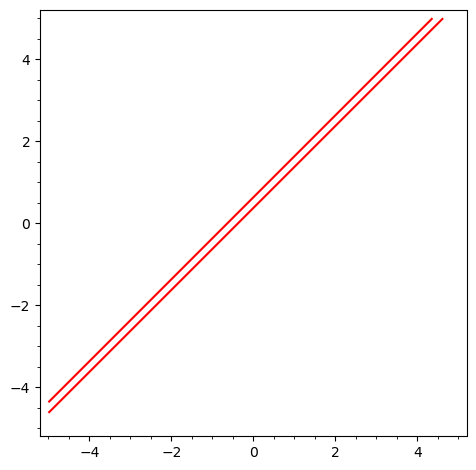
wich, IMNSHO, describes exactly what happens.
Since your function is polynomial, it is tempting to plot the ideal that your polynomial defines. However, since the same implicit_plot is ultimately used, the same problem happens :
sage: R1.<u, v>=QQ[]
sage: R1.ideal((v-u-1/2)^2).plot()
/usr/local/sage-9/src/sage/plot/contour_plot.py:988: UserWarning: pathological contour plot of a function whose values all lie on one side of the sole contour; we are adding more plot points and perturbing your function values.
  warn("pathological contour plot of a function whose "
Launched png viewer for Graphics object consisting of 1 graphics primitive
Here, a bit of reflection helps. as long as $x\in\mathbb{R}$, $x^2=0\Rightarrow{}x=0$. This is also true if you substitute $y-x-\frac{1}{2}$ for $x$. Therefore,
sage: implicit_plot(y-x-1/2, (x, -5, 5), (y, -5, 5))
Launched png viewer for Graphics object consisting of 1 graphics primitive
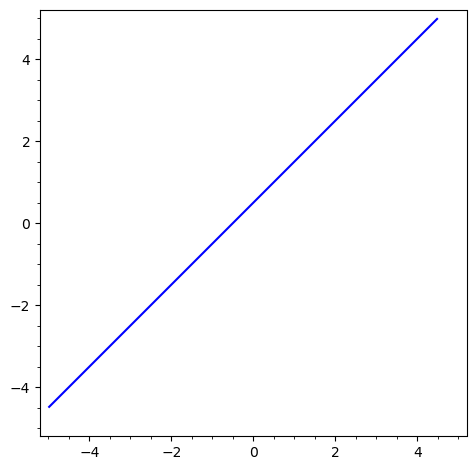
suffices.
HTH,
