Ask Your Question
0

Evaluate variable in plot label

asked 2022-04-10 20:53:04 +0200

c.p. gravatar image

I have several plots with labels that I would like to evaluate. For instance

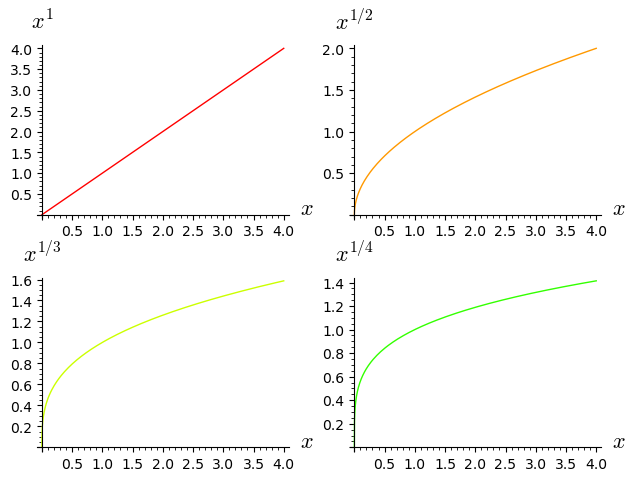
all=[plot(x^(1/(i+1)),(x,0,4), rgbcolor=hue(i/10),axes_labels=[r"$x$",r"$x^{1/(1+%d)}$"%i]) for i in range(4)]

leads to all[2] showing me (sorry for not being able to upload due to <60 points) the plot lablel $x^{1/(1+1)}$, which I would like to display after evaluation ($x^{1/2}$)

By defining the function $f(i)=i+1$ in the preamble of the graph I still cannot evaluate $f$, for $i$ is not evaluated inside the list

Even supposing I would, suppose I want the exponent in digits form. I am unable to find the string splicing character which also evaluates and then displays 0.5 (instead of a single digit). Does anybody know about how to correct this syntax?

edit retag flag offensive close merge delete

1 Answer

Sort by ยป oldest newest most voted
1

answered 2022-04-10 22:45:34 +0200

Emmanuel Charpentier gravatar image

updated 2022-04-10 22:46:26 +0200

What about :

![sage: all=[plot(x^(1/(i+1)),(x,0,4), rgbcolor=hue(i/10),axes_labels=[r"$x$",r"$x^{%s}$"%str(1/(1+i))]) for i in range(4)]
sage: graphics_array(all, 2, 2)
Launched png viewer for Graphics Array of size 2 x 2]

image description

edit flag offensive delete link more

Comments

Nice, thank you!

c.p. gravatar imagec.p. ( 2022-04-11 07:21:58 +0200 )edit

Your Answer

Please start posting anonymously - your entry will be published after you log in or create a new account.

Add Answer

Question Tools

1 follower

Stats

Asked: 2022-04-10 20:53:04 +0200

Seen: 116 times

Last updated: Apr 10 '22