Ask Your Question
1

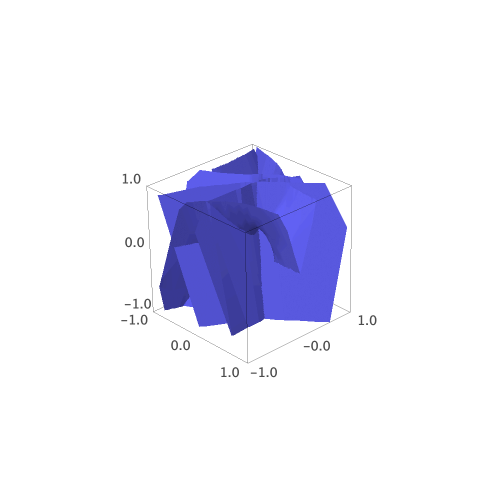
Is there any way to change the view box on a 3D graph?

asked 2021-07-31 00:13:26 +0200

drakezhard gravatar image

updated 2021-07-31 07:13:53 +0200

slelievre gravatar image

I plotted:

var('z')
E = EllipticCurve(QQ, [0,0,0,-1/4,0])
wp = E.weierstrass_p().laurent_polynomial()
wpp = derivative(wp,z)

f = (lambda u,v: wp(u+i*v).real(), lambda u,v: wp(u+i*v).imag(), lambda u,v: wpp(u+i*v).imag())

parametric_plot3d(f, (0.001,3.74), (0.001,3.74))

I just want to look at [-1,1] x [-1,1] x [-1,1], I can't seem to find the option.

edit retag flag offensive close merge delete

1 Answer

Sort by » oldest newest most voted
2

answered 2021-07-31 09:13:02 +0200

FrédéricC gravatar image

updated 2021-07-31 18:55:42 +0200

slelievre gravatar image

Use the add_condition method of the plot. See

The graph with the desired bound can be constructed as:

E = EllipticCurve(QQ, [0, 0, 0, -1/4, 0])
wp = E.weierstrass_p().laurent_polynomial()
wpp = wp.derivative()
f = (lambda u, v: wp(u + i*v).real(),
     lambda u, v: wp(u + i*v).imag(),
     lambda u, v: wpp(u + i*v).imag())
in_box = lambda x, y, z: all(-1 < t < 1 for t in (x, y, z))
P = parametric_plot3d(f, (0.001, 3.74), (0.001, 3.74))
Q = P.add_condition(in_box)

Then the graph can be displayed:

Q

SageMath 3D plot as parametric_plot3d with bounds on coordinates

edit flag offensive delete link more

Your Answer

Please start posting anonymously - your entry will be published after you log in or create a new account.

Add Answer

Question Tools

Stats

Asked: 2021-07-31 00:13:26 +0200

Seen: 204 times

Last updated: Jul 31 '21