Revision history [back]
| | 1 | initial version |

Use the add_conditionmethod of the plot. See https://doc.sagemath.org/html/en/reference/plot3d/sage/plot/plot3d/index_face_set.html?highlight=add_condition#sage.plot.plot3d.index_face_set.IndexFaceSet.add_condition
| | 2 | No.2 Revision |
Use the add_condition method of the plot. See https://doc.sagemath.org/html/en/reference/plot3d/sage/plot/plot3d/index_face_set.html?highlight=add_condition#sage.plot.plot3d.index_face_set.IndexFaceSet.add_conditionplot.
See
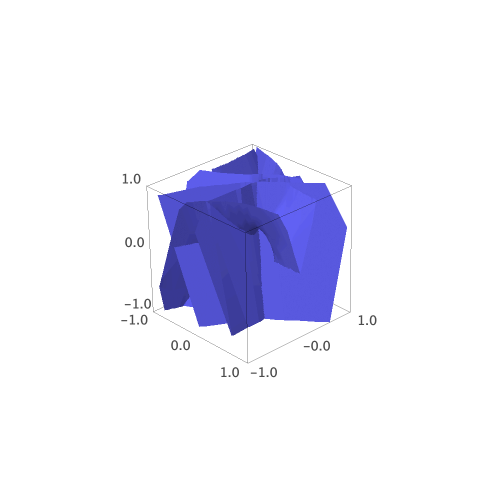
The graph with the desired bound can be constructed as:
E = EllipticCurve(QQ, [0, 0, 0, -1/4, 0])
wp = E.weierstrass_p().laurent_polynomial()
wpp = wp.derivative()
f = (lambda u, v: wp(u + i*v).real(),
     lambda u, v: wp(u + i*v).imag(),
     lambda u, v: wpp(u + i*v).imag())
in_box = lambda x, y, z: all(-1 < t < 1 for t in (x, y, z))
P = parametric_plot3d(f, (0.001, 3.74), (0.001, 3.74))
Q = P.add_condition(in_box)
Then the graph can be displayed:
Q