Ask Your Question
1

Graphs on 6 vertices with eigenvalue condition

asked 2020-12-23 22:25:05 +0200

anonymous user

Anonymous

updated 2020-12-24 02:01:03 +0200

slelievre gravatar image

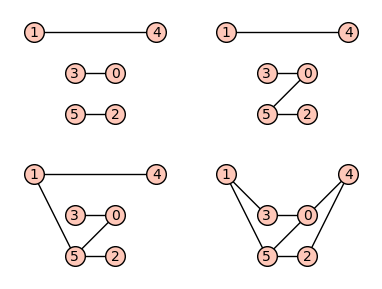
Consider the class of all possible connected simple graphs on $6$ vertices. Now from this collection, can we find those graphs (if there exists any) satisfying the following property: Suppose that $A$ denotes the usual $(0,1)$ adjacency matrix of a graph. Now can we find those graphs explicitly (if there is any) on $6$ vertices such that if $\lambda$ is an eigenvalue of $A$, then $\dfrac{1}{\lambda}$ and $-\dfrac{1}{\lambda}$ both are eigenvalues. Simply the question can be said as: Characterize all possible simple connected graphs on $6$ vertices such that if $\lambda$ is an eigenvalue of $A$, then $\dfrac{1}{\lambda}$ and $-\dfrac{1}{\lambda}$ both are eigenvalues.

please help regarding this problem.
edit retag flag offensive close merge delete

Comments

Follow-up question at Ask Sage question 54927.

slelievre gravatar imageslelievre ( 2020-12-27 00:28:53 +0200 )edit

1 Answer

Sort by ยป oldest newest most voted
2

answered 2020-12-24 01:57:44 +0200

slelievre gravatar image

updated 2020-12-24 02:04:32 +0200

Graphs on 6 vertices with eigenvalue condition

SageMath can call Nauty for enumerating graphs up to isomorphism.

This is done via the graphs.nauty_geng command.

Then one can filter by checking the conditions in the question (which amount to the set of eigenvalues avoiding zero and being stable by opposite and by inverse).

Define the requested list using nauty_geng and list comprehension.

sage: gg = [g for g in graphs.nauty_geng("6")
....:       if all(e and -e in ee and 1/e in ee
....:              for ee in [g.adjacency_matrix().eigenvalues()]
....:              for e in ee)]

Some graphics options and positioning for plotting:

sage: pos = dict(enumerate([(2, 1), (0, 2), (2, 0), (1, 1), (3, 2), (1, 0)]))
sage: opt = {'xmin': -0.5, 'xmax': 3.5, 'ymin': -0.5, 'ymax': 2.5}

The four graphs:

sage: p = graphics_array([g.plot(pos=pos, **opt) for g in gg], ncols=2)
sage: p.show(figsize=4)

Graphs on 6 vertices with eigenvalue condition

To save the picture to a file:

sage: filename = "ask-54878-graphs-n6-eigencondition.png"
sage: p.save(filename, transparent=True, figsize=4)

To request connectedness, call nauty_geng("6 -c") instead of nauty_geng("6").

edit flag offensive delete link more

Comments

This is a very nice answer. Thank you

rewi gravatar imagerewi ( 2020-12-24 17:10:25 +0200 )edit

Your Answer

Please start posting anonymously - your entry will be published after you log in or create a new account.

Add Answer

Question Tools

1 follower

Stats

Asked: 2020-12-23 22:25:05 +0200

Seen: 284 times

Last updated: Dec 24 '20