Ask Your Question
0

plot does not gibe with solve for log equations

asked 2020-11-11 02:48:58 +0100

cybervigilante gravatar image

If I plot two log equations in x and y I get an obvious intersection, but when I try solve on them I get nothing. Is there a way to get a mathematical solution that gibes with the plot?

var('x y')
implicit_plot(log(x*sqrt(y)),(x,0,8),(y,0,8),color="black") + implicit_plot(log(x^2*y^2),(x,0,8),(y,0,8),color="red")

solve(log(x*sqrt(y)) == log(x^2*y^2),x,y)
[]
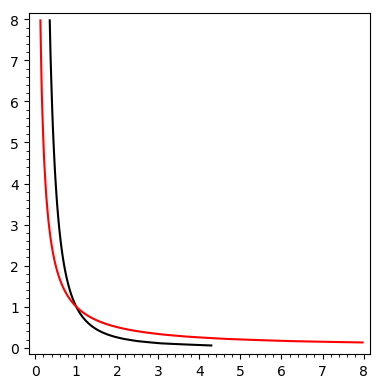
image description

edit retag flag offensive close merge delete

1 Answer

Sort by ยป oldest newest most voted
1

answered 2020-11-11 08:18:02 +0100

Emmanuel Charpentier gravatar image

Your curves are the plots of $\log(x\sqrt{y})=0$ and $\log(x^2y^2)=0$ respectively. The equation $\log(x\sqrt{y})=\log(x^2y^2)$ is more general, and has an infinity of solutions:

sage: (log(x*sqrt(y))==log(x^2*y^2)).log_expand().solve(y)
[y == x^(-2/3)]

The intersection point of your curves is a special case of this general solution, where both left-hand and right-hand of the equation are null ; this is a system of two equations, which Sage can solve:

sage: solve([log(x*sqrt(y))==0,log(x^2*y^2)==0],[x,y])
[[x == 1, y == 1]]

HTH,

edit flag offensive delete link more

Your Answer

Please start posting anonymously - your entry will be published after you log in or create a new account.

Add Answer

Question Tools

1 follower

Stats

Asked: 2020-11-11 02:48:58 +0100

Seen: 184 times

Last updated: Nov 11 '20