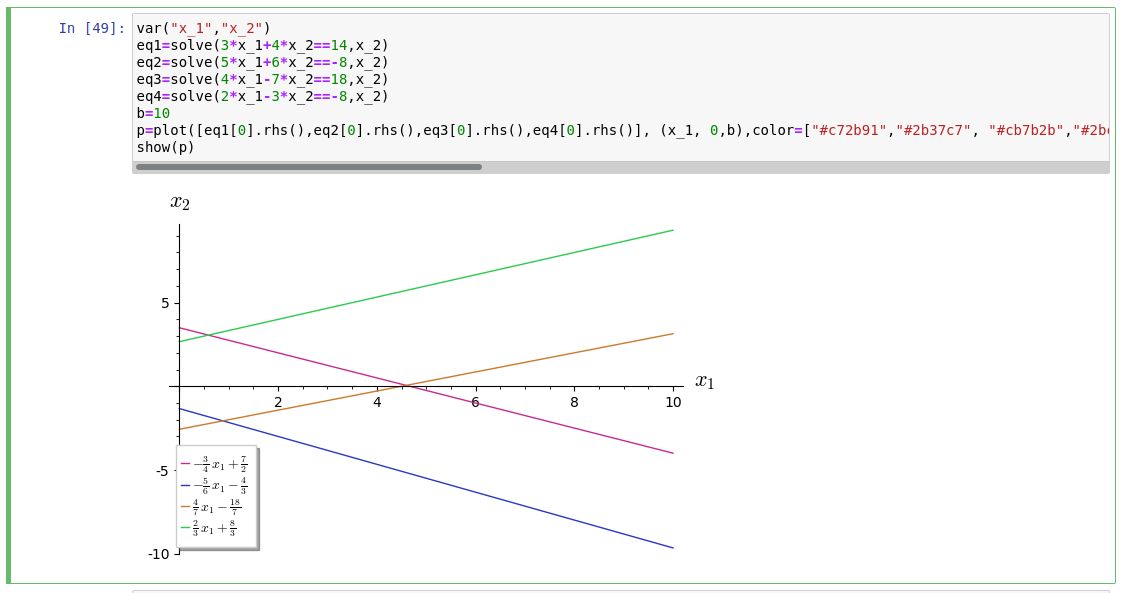
Plot legend in latex from equations in Sagemath
 var("x_1","x_2")
eq1=solve(3*x_1+4*x_2==14,x_2)
eq2=solve(5*x_1+6*x_2==-8,x_2)
eq3=solve(4*x_1-7*x_2==18,x_2)
eq4=solve(2*x_1-3*x_2==-8,x_2)
b=10
p=plot([eq1[0].rhs(),eq2[0].rhs(),eq3[0].rhs(),eq4[0].rhs()], (x_1, 0,b),color=["#c72b91","#2b37c7", "#cb7b2b","#2bcb4b"],axes_labels=["$x_1$","$x_2$"],legend_label='automatic')
show(p)
This is an acceptable plot up to the point that in the legends one find x_1 and not $x_1$ as in the axes labels. Is there a way to cope with this ?

