Ask Your Question
0

Running the Solow Model in Sage and Plotting it.

asked 2020-07-17 23:00:20 +0100

EconJohn gravatar image

As some of the regulars on this forum could tell I've really gotten into sage for its appications to economics problems. I came up withthe following code for the Solow growth model in sage.

k,k1, alpha, A, delta, s, c=var('k,k1, alpha, A, delta, s, c')
#Initial Values
k=10
s=0.5
A=5
alpha=0.6
delta=0.8
#Equations of Interest
f(k)=A*k^alpha    
k1=f(k)-(1-delta)*k
invest=s*f(k)
#Visualizing the Solow Model
prod=plot(f(k),(k,1,100),color='blue')
lom=plot(delta*k,(k,1,100),color='red')
savings=plot(invest,(k,1,100),color='green')  
prod+lom+savings
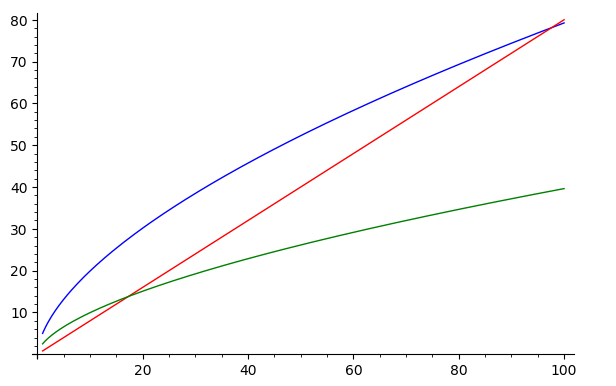
image description

I'm interested to see if I can make a dotted line from the x-axis and y-axis to show where the green and red lines intersect or even better display a number.

To visualize what I want I've used microsoft paint to aid my graphics below.
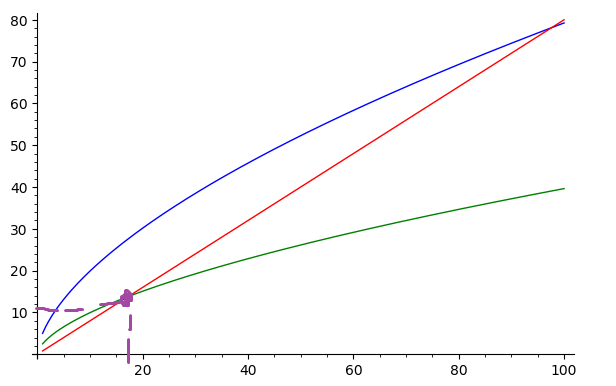
image description

However this isn't the prettiest visualization and I'm wondering if I could get better graphics in sage. Any help is appreciated.
edit retag flag offensive close merge delete

2 Answers

Sort by ยป oldest newest most voted
1

answered 2020-07-17 23:42:21 +0100

philipp7 gravatar image

updated 2020-07-17 23:46:40 +0100

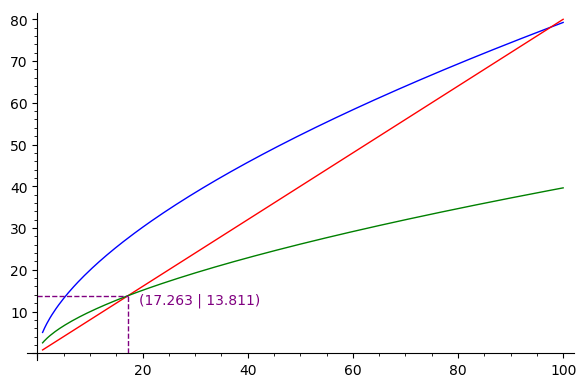
Here is some sample code which should do what you want:

entPlot = prod+lom+savings

# compute intersection points
intX = solve(delta*k == invest, k, to_poly_solve=True)[1].rhs()
intY = invest(intX)

# define all plot elements
linesPlot = line([(intX,0), (intX,intY)], color="purple", linestyle="--") 
linesPlot += line([(0,intersectionY), (intX,intY)], color="purple", linestyle="--") 
txtPointInt = "(" + str(n(intX, digits=5)) + " | " + str(n(intY, digits=5)) + ")"
textPlot = text(txtPointInt, (intX + 2, intY - 1), color="purple", horizontal_alignment="left")

show(entPlot + linesPlot + textPlot)

For references: On how to plot lines, e.g. https://ask.sagemath.org/question/38630/how-to-plot-vertical-lines/On how to plot and which options where are to pretty up your plots (you should just try around with the options you see there): https://doc.sagemath.org/html/en/refe...

Output of the code from above: image description

edit flag offensive delete link more
1

answered 2020-07-18 00:30:28 +0100

Emmanuel Charpentier gravatar image

A modest proposal (with a few suggestions) :

k, alpha, A, delta, s, c=var('k, alpha, A, delta, s, c')
#Initial Values
# k=10 # It's a variable !
s=0.5
A=5
alpha=0.6
delta=0.8
# Equations of Interest : define FUNCTIONS (much cleaner, lighter, independent of the variable name)
f(k)=A*k^alpha    
k1(k)=f(k)-(1-delta)*k
invest(k)=s*f(k)
dk(k)=delta*k
# Visualizing the Solow Model ; lighter notations allowed by functions
prod=plot(f,(1,100),color='blue')
lom=plot(dk,(1,100),color='red')
savings=plot(invest,(1,100),color='green')
#  Curves intersection.
# Symbolic way :
Sol=(dk(k)==invest(k)).log().log_expand().solve(k) # Avoid the trivial nonsensical solution
print("invest(k)==delta*k for {}".format(Sol))
# SolN=Sol[0].rhs().n()
# Alternate way to solve numerically
SolN=SR(find_root(invest(x)-dk(x),1,100)) # Conversion to SR to allow use og .n()...
Sav=invest(k=SolN)
print("Intersection at ",(SolN,Sav))
prod+lom+savings+line([(SolN,0),(SolN,Sav),(0,Sav)], linestyle="dashed")+\
text(" k={}, invest={}".format(SolN.n(digits=3), Sav.n(digits=3)),(SolN,Sav),\
     horizontal_alignment="left", vertical_alignment="top", color="black")

HTH,

edit flag offensive delete link more

Your Answer

Please start posting anonymously - your entry will be published after you log in or create a new account.

Add Answer

Question Tools

1 follower

Stats

Asked: 2020-07-17 23:00:20 +0100

Seen: 431 times

Last updated: Jul 18 '20