Ask Your Question
1

Can you specify an explicit curve by specifying its x,y points ?

asked 2020-04-29 16:38:12 +0200

Mo gravatar image

updated 2020-04-30 15:38:59 +0200

I was wondering if I can specify a curve by giving its x,y points:

(0,0),(0.5, 0.25),(0.6, 0.36),(2.0, 4.0)

and then do various other manipulation of this curve like, interpolation, derivative at some point, aread under the curve between two points (integral) etc?

edit retag flag offensive close merge delete

Comments

There are essentially an infinite number of curves going through 5 points. But if you adjust say by mean squarre a polynomial of 5th degree it will run through this 5 points. Then you will have a function and you will be able to manipulate it.

Cyrille gravatar imageCyrille ( 2020-04-30 08:27:28 +0200 )edit

Thanks for the comment. That obviously can be done and its interesting. I take it that the answer to the original question is no then?

Mo gravatar imageMo ( 2020-04-30 15:20:56 +0200 )edit

I am trying to make the program but I have a problem for the optimization. I have ask a question and I wait for the answer

Cyrille gravatar imageCyrille ( 2020-04-30 17:17:43 +0200 )edit

Thank you very much for the answer! so the work is in progress. That's an interesting approach.

Mo gravatar imageMo ( 2020-04-30 17:31:25 +0200 )edit

3 Answers

Sort by » oldest newest most voted
1

answered 2020-05-01 05:15:24 +0200

dsejas gravatar image

updated 2020-05-01 05:37:28 +0200

Hello, @Mo! As @Cyrille mentioned, given $n$ points, there exists an infinite number of curves that pass through them. However, there is a number of things you could do in order to obtain one of those curves. Let me explain three of them:

  1. You can take advantage of the particular characteristics of your set of points. In this case, a simple visual inspection will show that the points are of the form $(x, x^2)$. So, a good curve for this set is quite simply $y=x^2$.
  2. Of course, visual inspection is not always as easy as in this particular case. When you can't figure out the structure of function, a classical approach is to use interpolation polynomials. (This is also mentioned by @Cyrille.) Now, Sage has many interpolation facilities; in particular, there is the spline command. You can write something like this:

    points = [(0, 0), (0.5, 0.25), (0.6, 0.36), (2, 4)]
    S = spline(points)
    

    Now, S is an interpolation spline, which you can evaluate en $x=0.2$, for example, with S(0.2); you can plot S with plot(S, xmin=0, xmax=2); you can differentiate it in $x=1.3$ with S.derivative(1.3); you can integrate it in its whole domain with S.definite_integral(0, 2); you could even plot the derivative and the antiderivative with a little bit of clever programming.

    It is my understanding that splines are excellent approximating real-life functions, because natural phenomena tend to have smooth behavior. If these points were the result of measurements of a natural phenomenon in the lab, I would consider using splines for interpolation.

    The disadvantage of the spline command is that it doesn't give you an explicit formula for the function.

  3. There is another interpolation command which is a little more complicated, but more useful, in my humble opinion (in particular, it gives you a explicit formula). It's called lagrange_polynomial. In its simplest form, it uses divided differences to obtain the polynomial coefficients (you can read about that in any Numerical Methods book). You have to do something like this:

    PR = PolynomialRing(RR, 'x')
    points = [(0, 0), (0.5, 0.25), (0.6, 0.36), (2, 4)]
    poly = PR.lagrange_polynomial(points)
    print(poly)
    

    The first line creates a polynomial ring, which I called (creatively enough) PR, with real coefficients (thus the RR) and independent variable x (thus the 'x'). The second line is your set of points. The third line asks Sage to create the Lagrange Interpolation Polynomial in this polynomial ring. You should get something like this:

     -1.11022302462516e-16*x^3 + x^2 - 1.11022302462516e-16*x
    

    You can use this polynomial as with any other polynomial. You can make plot(poly, (x, 0, 2)), poly.derivative(x), poly.derivative(x)(1.3), poly.integrate(x), etc.

    However, as you can see, the coefficients for $x^3$ and $x$ are negligible, so you could deduce that poly is actually x^2. You can verify that using the following:

    PR = PolynomialRing(QQ, 'x')
    points = [(0, 0), (0.5, 0.25), (0.6, 0.36), (2, 4)]
    poly = PR.lagrange_polynomial(points)
    print(poly)
    

    This is exactly the same as before, but you use rational coefficients instead of real ones (thus the QQ). Of course, the same result is obtained if you replace QQ with ZZ, since, in this case, the coefficients turn out to be integers. the result is x^2, as suspected!

There are other methods you can use to obtain curves that pass through $n$ points, but these are the simplest and more usual (and useful). Just remember the two downsides of interpolation: (1) Your are getting only one of an infinite number of possible functions that pass through your points. (2) You should only work inside the interpolation interval (in particular, S(3) will return nan or not-a-number; poly(4) will evaluate correctly to 16, but you are, in that case, extrapolating, which is a very dangerous operation, especially in the lab).

I hope this helps!

edit flag offensive delete link more

Comments

Although I hope this solves the question, I still would like to see @Cyrille's solution, which sounds interesting!

dsejas gravatar imagedsejas ( 2020-05-01 05:18:01 +0200 )edit
1

answered 2020-05-01 15:20:49 +0200

Cyrille gravatar image

updated 2020-05-02 12:30:34 +0200

Here is my solution more involved than the one of dsejas, but perhaps it can help (Thanks to Sebastien)

# Polynomial interpolation
# Passing the matrix
A = Matrix([[0,0],[0.5,0.25],[0.6,0.36],[2,4]])
var('a0, a1, a2, a3')
B =[[A[i][1], a3*A[i][0]^3+ a2*A[i][0]^2+ a1*A[i][0]+ a0] for i in range(0,4)]
C=[[(B[i][0]-B[i][1])^2] for i in range(0,4)]
# sum of the square of errors
ssr=sum(C[i][0] for i in range(4))
# First order condition of optimality
ssr_a0=ssr.diff(a0)
ssr_a1=ssr.diff(a1)
ssr_a2=ssr.diff(a2)
ssr_a3=ssr.diff(a3)
# solution for coefficients
sol=solve([ssr_a0==0,ssr_a1==0,ssr_a2==0,ssr_a3==0,ssr_a4==0], a0, a1, a2, a3, solution_dict=True)
f(x)= a0 + a1*x+ a2*x^2 + a3*x^3
# g is a the desired function
g(x)=f(x).subs(sol[0])
# derivative of g
gp=g.diff(x)
pl=plot(g(x),(x,A[0][0],A[3][0]))
pl+=points((A[i] for i in range(4)),color='red',size=20)
pl+=plot(gp(x),(x,A[0][0],A[3][0]),color="green")
pl+=text("$f(x)$",(1.2,1),color="blue", fontsize='small', rotation=0)
pl+=text("$f'(x)$",(1.2,2.8),color="green", fontsize='small', rotation=0)
show(pl)
edit flag offensive delete link more

Comments

The line

ssr_a4=ssr.diff(a4)

should be removed as well as the ,ssr_a4==0 part or an error is raised (a4 is not defined).

Sébastien gravatar imageSébastien ( 2020-05-01 16:50:39 +0200 )edit

Done. I asked the subsidiary question : and if the datas came from an external file say an xls one.

Cyrille gravatar imageCyrille ( 2020-05-02 12:31:54 +0200 )edit
0

answered 2020-05-01 19:15:25 +0200

Juanjo gravatar image

updated 2020-05-01 19:21:14 +0200

Assume that we have $n+1$ data points $(x_0,y_0),\ldots,(x_n,y_n)$, with $x_i\ne x_j$ for $i\ne j$. Then, there exists a unique polynomial $f$ of degree $\leq n$ such that $f(x_i)=y_i$ for $i=0,\ldots,n$. This is the Lagrange polynomial that interpolates the given data. In his answer, @dsejas has shown a method to compute it. In the current case, since $n=3$, the interpolating polynomial has degree $\leq3$; in fact, it is $f(x)=x^2$.

If $f(x)=a_0+a_1x+\cdots+a_nx^n$, it follows from the interpolation conditions that the coefficients are the solution of the linear system $A\mathbf{x}=\mathbf{b}$, where $A=(x_i^j)$ (the element of $A$ at row $i$ and column $j$ is $x_i^j$), $\mathbf{b}=(y_i)$ and $\mathbf{x}$ is the vector of unknowns $a_0,\ldots,a_n$. This is not the best way to get $a_0,\ldots,a_n$, since $A$ is usually an ill conditioned matrix. However, it is interesting to point out that from a theoretical viewpoint.

If one has $m$ data points and still wants to fit them using a polynomial of degree $n$, with $n\leq m$, the linear system $A\mathbf{x}=\mathbf{b}$ is overdetermined (there are more equations than unknowns). In such a case, one can perform a least squares fitting, trying to minimize the interpolation errors, that is, one seeks for the minimum of $$E(a_0,a_1,\ldots,a_n)=\sum_{i=0}^m (f(x_i)-y_i)^2.$$ The minimum is given by the solution of the linear system $$ \nabla E(a_0,a_1,\ldots,a_n)=\mathbf{0},$$ which is simply $A^TA\mathbf{x}=A^T\mathbf{b}$. This is what @Cyrille, in fact, proposes in his answer... computing explicitly $E(a_0,a_1,\ldots,a_n)$ as well as its partial derivatives, which is completely unnecessary. In fact, if the system $A\mathbf{x}=\mathbf{b}$ has a unique solution, which is the case under discussion, the system $A^TA\mathbf{x}=A^T\mathbf{b}$ yields exactly the same solution. So, the function in @Cyrille's answer is just the Lagrange polynomial already proposed by @dsejas.

There are functions to compute least squares approximations in libraries like Scipy. Anyway, for such a simple case as that considered here, the following (suboptimal) code may work. Please note that I have added some points to make the example a bit more interesting:

# Data
data = [(0,0), (0.2,0.3), (0.5,0.25), (0.6,0.36), 
        (1,1), (1.2, 1.3), (1.5,2.2), (1.7,3.1), (2,4)]
# Computation of a fitting polynomial of degree <=3
basis = vector([1, x, x^2, x^3])
A = matrix(len(data),len(basis),
           [basis.subs(x=datum[0]) for datum in data])
b = vector([datum[1] for datum in data])
coefs = (transpose(A)*A)\(transpose(A)*b)
f(x) = coefs*basis
# Plot results
abcissae = [datum[0] for datum in data]
x1, x2 = min(abcissae), max(abcissae)
pl = plot(f(x), (x, x1, x2))
pl += points(data, color="red", size=20)
show(pl)

This code yields the following plot:

image description

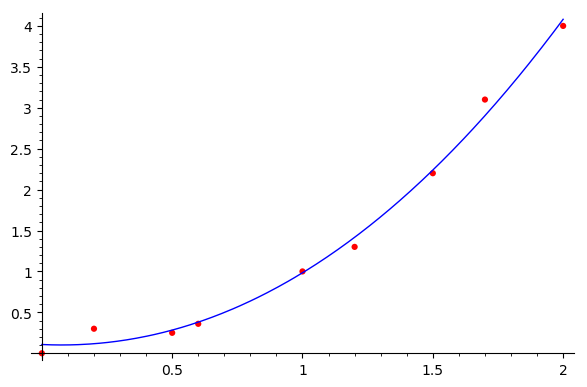
Of course, in addition to polynomial interpolation or fitting, there are many other methods which can be used.

edit flag offensive delete link more

Comments

I completely agree. Your solution is the one of the econometrics books. I don't know why when I tried it I have an uninversible matrix $^\top{X} X$. what shoul be nice is to add a way to read the values from an external file say a xls one.

Cyrille gravatar imageCyrille ( 2020-05-02 12:27:44 +0200 )edit

Your Answer

Please start posting anonymously - your entry will be published after you log in or create a new account.

Add Answer

Question Tools

1 follower

Stats

Asked: 2020-04-29 16:38:12 +0200

Seen: 686 times

Last updated: May 02 '20