Ask Your Question
2

3D graphics, contour plot and labels

asked 2020-04-27 19:48:11 +0100

Cyrille gravatar image

updated 2020-04-28 16:29:20 +0100

slelievre gravatar image

This code works perfectly

w, w1, w2, p, a = var('w w1 w2 p a')
U(w, a) = w^a  # La fonction doit être fonction de ses variables et paramètres
a = 0.6
p = 0.5
f = p * U(w1, a) + (1 - p) * U(w2, a)
G = plot3d(f, (w1, 1e-4, 5), (w2, 1e-4, 5), frame=False, color='wheat', opacity=0.6)
G += arrow3d((0, 0, 0), (5, 0, 0), color='green')
G += arrow3d((0, 0, 0), (0, 5, 0), color='green')
G += arrow3d((0, 0, 0), (0, 0, 3), color='green')
G += text3d("$U(w) = w^a$", (1, 2, 3), color=(0.5, 0, 0))

show(G, viewer='threejs')
contour_plot(f, (w1, 0, 5), (w2, 0, 5))

I have 4 questions

  1. is it possible to include latex text in a 3D setting?
  2. is it possible to label the axes (preferably in the same way)?
  3. is it possible to combine the contour_plot on the surface?
  4. is it possible to project the contour_plot on (x, y) plane?
edit retag flag offensive close merge delete

Comments

Excellent questions. I suspect 1 is not implemented, not sure about 2.

It could be that text3d is from Sage's early days and needs tender loving care.

Regarding 3 and 4, maybe answers to previously asked questions can offer hints.

slelievre gravatar imageslelievre ( 2020-04-28 01:04:04 +0100 )edit

I am too beginer to be sure of what I say but I wonder if it could be possible to draw the contour on a surface using a color function

Cyrille gravatar imageCyrille ( 2020-04-28 18:00:46 +0100 )edit

3 Answers

Sort by » oldest newest most voted
1

answered 2020-04-28 14:48:22 +0100

eric_g gravatar image

updated 2020-04-28 16:29:34 +0100

slelievre gravatar image

This replies to question 2 only: you can label the axes via the option axes_labels, which defaults to ['x', 'y', 'z']. This option works only for threejs and only if frame is set to True. Alas, it does not allow for LaTeX rendering... For your example,

show(G, viewer='threejs', frame=True, axes_labels=['w1', 'w2', 'U'])

does the job. If you are using a version of SageMath >= 9.0, you can skip viewer='threejs', since this is the default.

edit flag offensive delete link more

Comments

Thanks for your help but presenting a graphic with a font distinct from the one used in math is not very sexy. Hope some one will add mathjax to 3Dplot.

Cyrille gravatar imageCyrille ( 2020-04-28 17:58:28 +0100 )edit

So just to be sure sure, there are no way as of now to render LaTex in labeling axes for graphics3D?

Ammar gravatar imageAmmar ( 2020-06-24 02:58:37 +0100 )edit

@Ammar: Not to my knowledge...

eric_g gravatar imageeric_g ( 2020-06-24 09:15:29 +0100 )edit
5

answered 2020-05-02 03:56:34 +0100

Juanjo gravatar image

I will try to answer to questions 3 and 4. I don't really know if you can directly place on the surface the level curves generated by contour_plot or put them on the $xy$ plane. It seems to me that SageMath doesn't have a command or function for doing so. In fact, the plot3d method for 2D graphics doesn't work for contour plots.

However, you can mimic the expected result by playing with colors. To exemplify the method, let us consider the function $$f(x,y) = \frac{2x+3y^2}{(x^2+y^2+1)^2}.$$ Here we have its contour plot in $[-2,2]\times[-2,2]$:

var("x,y,z")
f(x,y) = (2*x+3*y^2) / (x^2+y^2+1)^2
# Contours from z1 to z2. 
# This interval is divided into ni subintervals
z1, z2 = -0.6, 0.8
ni = 10
dz = (z2-z1)/ni
levels = [z1,z1+dz..z2]
curves = contour_plot(f(x,y), (x,-2,2), (y,-2,2), contours=levels, 
                      cmap="jet", colorbar=True)
show(curves)
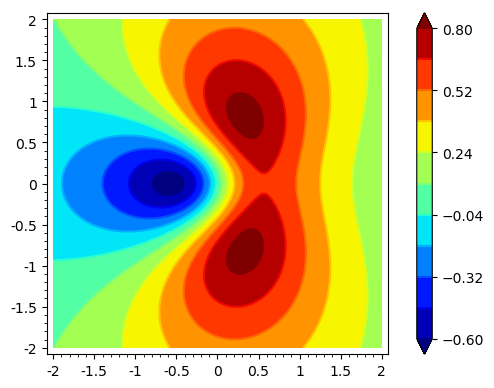
image description

Please, note that I have explicitly provided the levels to be plotted in order to compare this figure with that of the surface.

Now we plot the surface $z=f(x,y)$ using plot3d. Through a convenient definition of the color function, you can reproduce the very same contours on the surface:

# Surface plot using plot3d
def col2(x,y):
    return float(0.5*dz+floor((f(x,y)-z1)/dz)/ni)
surf = plot3d(f(x,y), (x,-2,2), (y,-2,2), color=(col2,colormaps.jet), plot_points=300)
show(surf, aspect_ratio=[1,1,2])
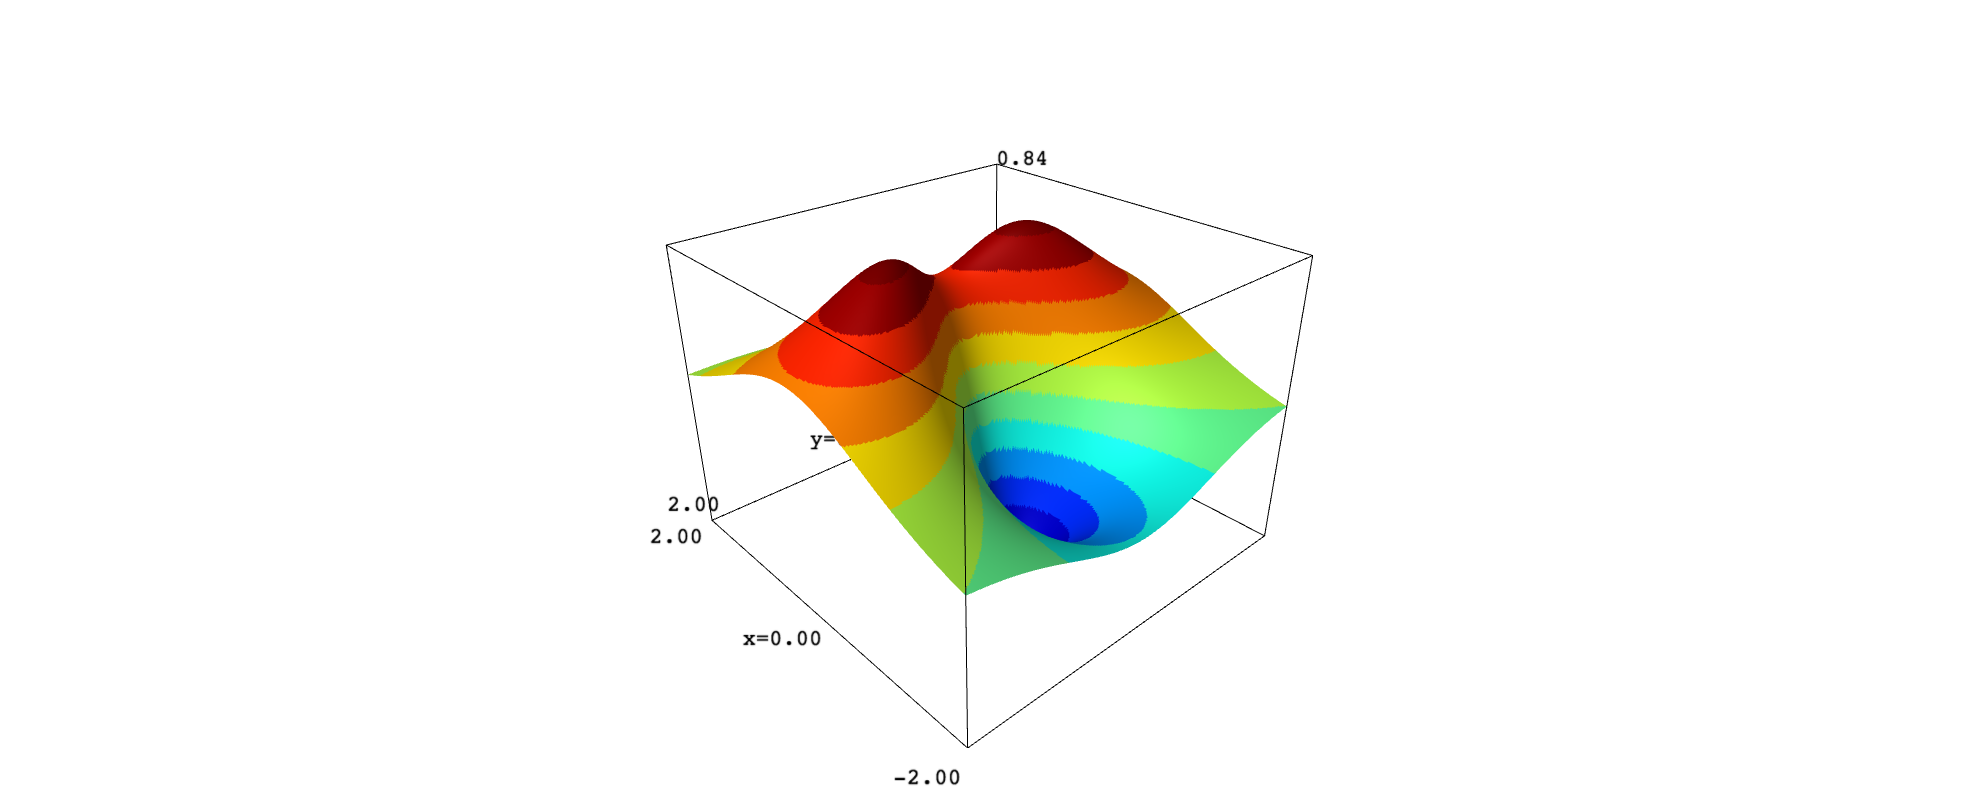
image description

If we use an orthographic projection, we can then rotate the surface to look at it from above and compare with the contour plot:

show(surf, projection="orthographic")
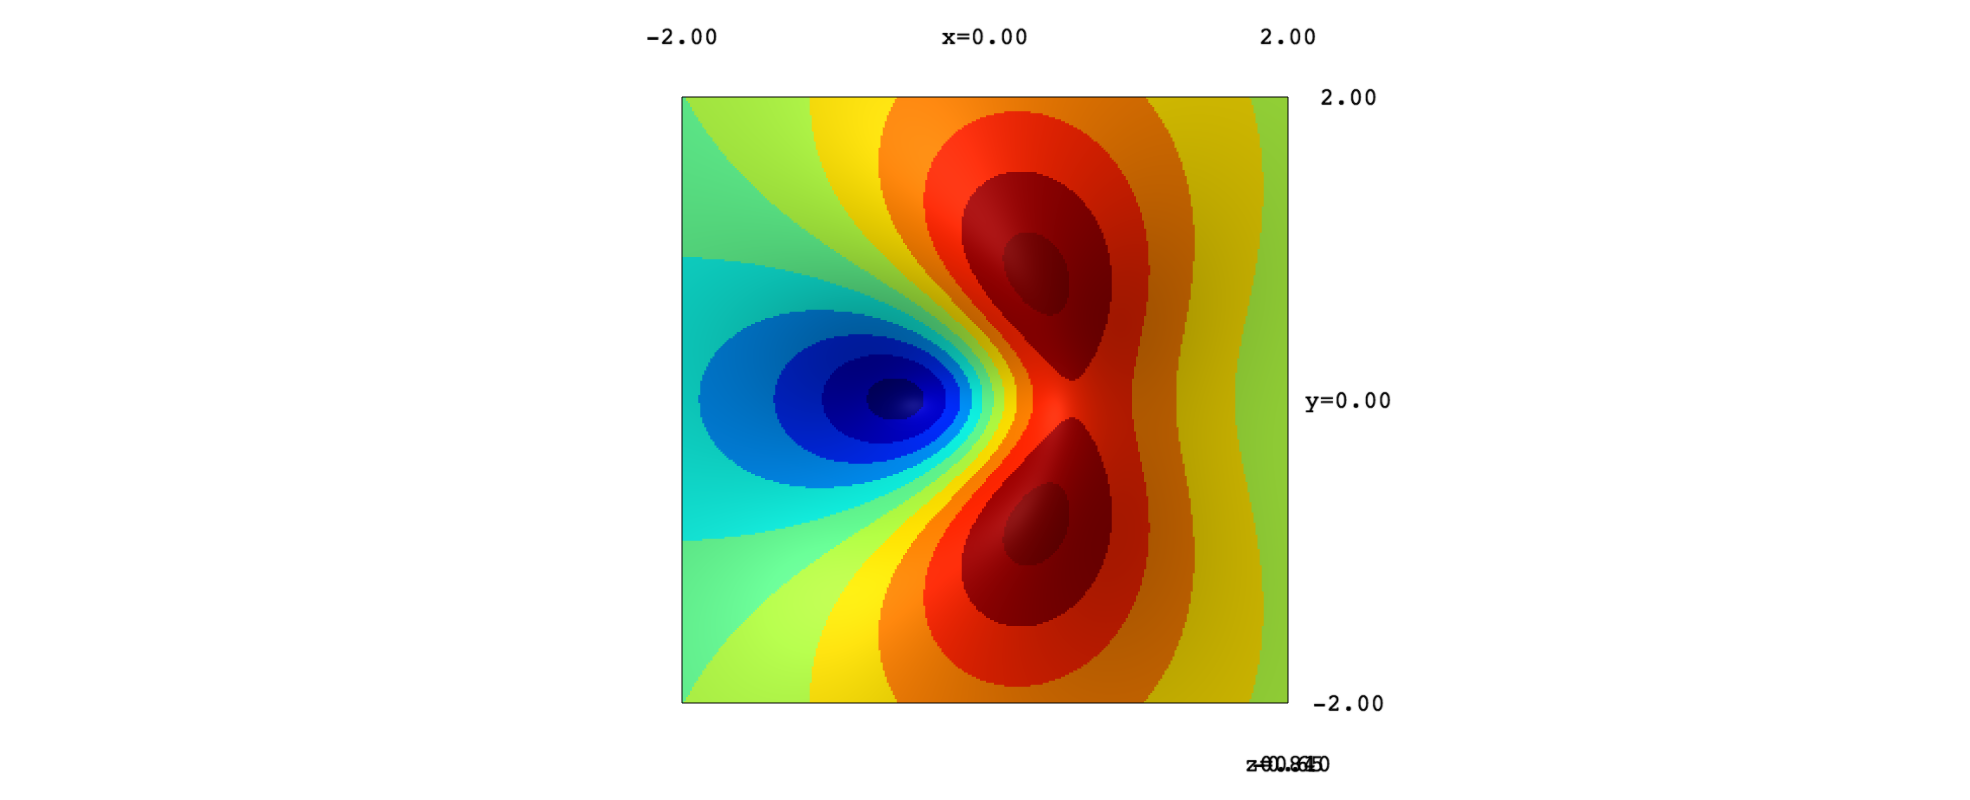
image description

The same strategy serves to color a plane below the surface, simulating a projection of the contours on the $xy$ plane:

offset = -1.4
plane = plot3d(offset, (x,-2,2), (y,-2,2), color=(col2,colormaps.jet), plot_points=300)
show(surf+plane)
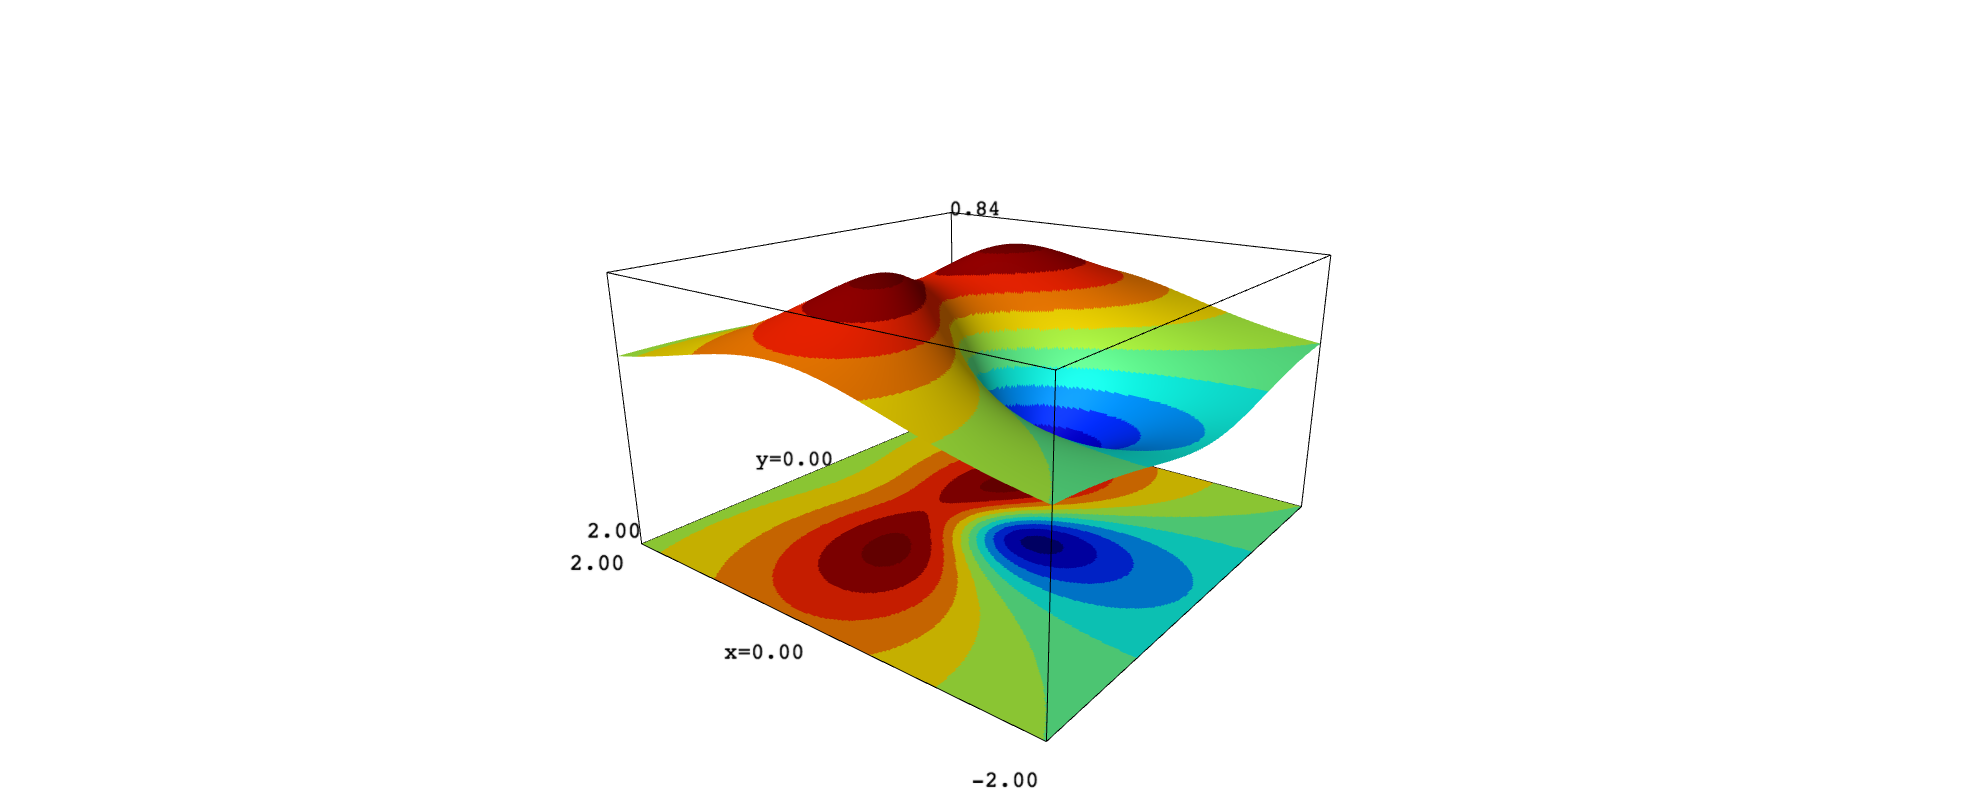
image description

The problem with this approach is that the surface looks jagged, even using a great number of plot points. As an alternative, we can apply implicit_plot3d:

# Surface plot using implicit_plot3d
zmin, zmax = -1, 1
def col3(x,y,z):
    return float(0.5*dz+floor((z-z1)/dz)/ni)
surf_new = implicit_plot3d(z==f(x,y), (x,-2,2), (y,-2,2), (z,zmin,zmax), 
                           color=(col,colormaps.jet), plot_points=[50,50,300])
show(surf_new, aspect_ratio=[1,1,2])
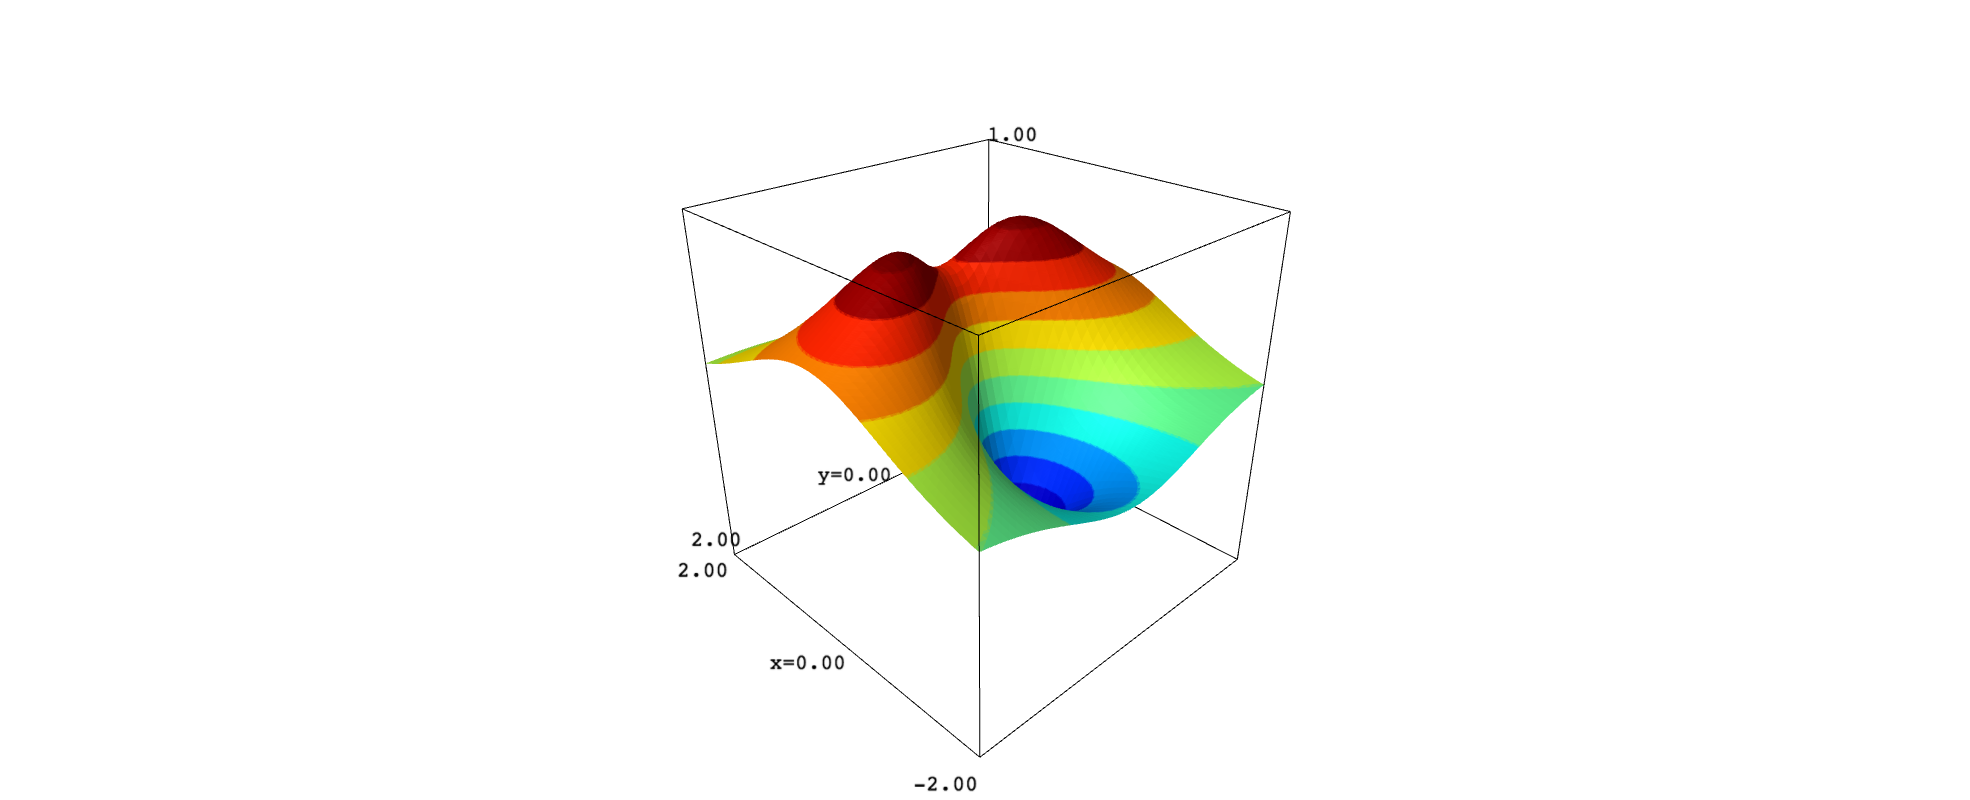
image description

Here we have again a view from above:

show(surf_new, projection="orthographic")
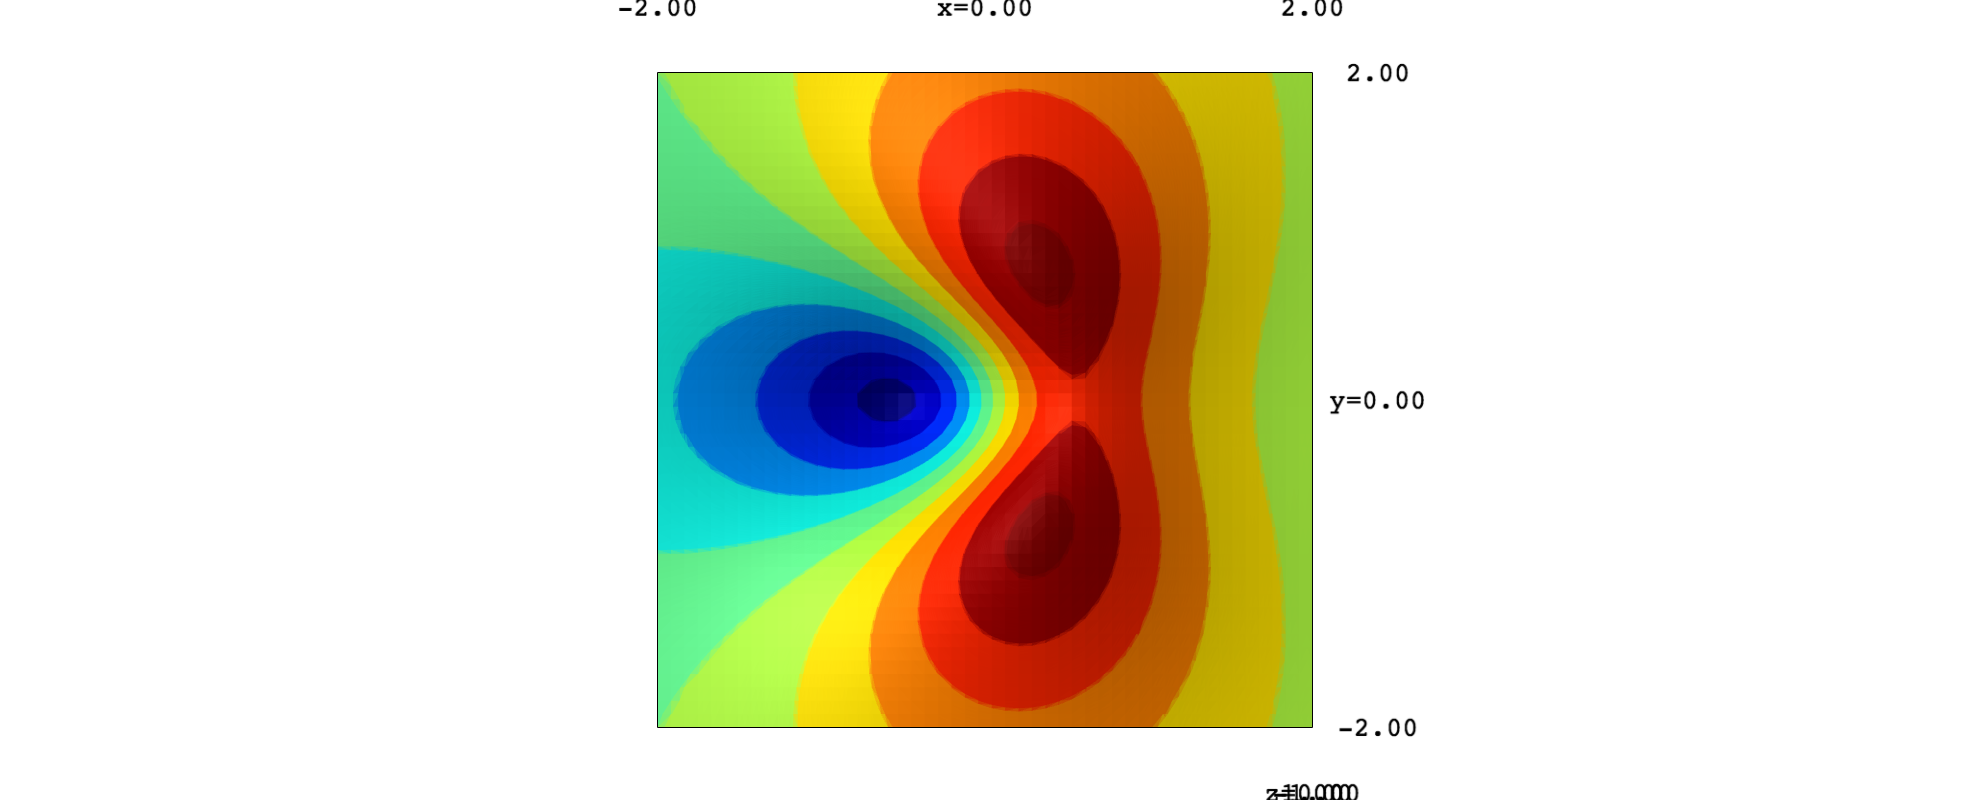
image description

And the surface with the plane:

show(surf_new+plane)
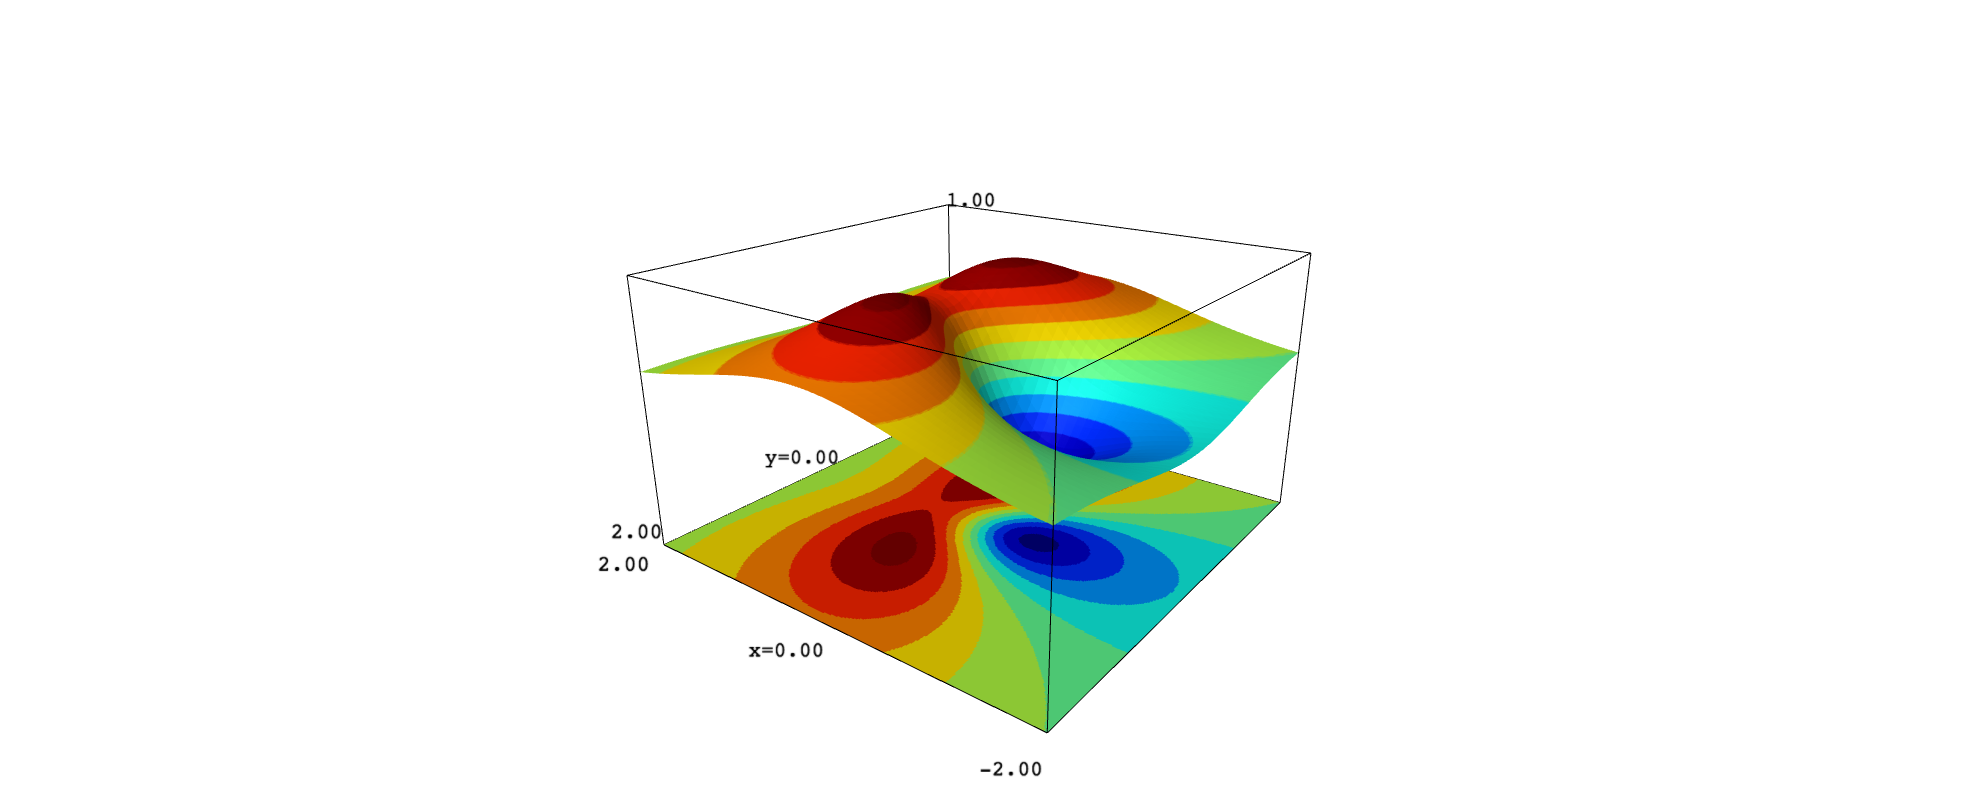
image description

It seems that implicit_plot3d provides smoother curves on the surface. To get them, it is important to use many points along the $z$-direction.

edit flag offensive delete link more

Comments

This is a great answer Thanks.

Cyrille gravatar imageCyrille ( 2020-05-02 12:35:25 +0100 )edit
0

answered 2020-07-26 23:13:46 +0100

slelievre gravatar image

Regarding question 1, LaTeX in text3d is not implemented yet.

There is however a ticket to track progress on that issue:

and there have been numerous requests for this.

There is interest from at least one knowledgeable developer, so hopefully some future version of Sage will have that!

edit flag offensive delete link more

Your Answer

Please start posting anonymously - your entry will be published after you log in or create a new account.

Add Answer

Question Tools

2 followers

Stats

Asked: 2020-04-27 19:48:11 +0100

Seen: 2,390 times

Last updated: Jul 26 '20