Ask Your Question
0

Problems with plot

asked 2020-04-10 12:28:26 +0200

Cyrille gravatar image

In the following code

var("b, p, w")

b=1 # pouvoir de monopole

p=0.5 # probabilité qu'il ne se produise rien

w0=8 # richesse initiale

x=2 #taille du risqe

T1=text("$Loteries$ $inaccesibles$",(3.5,9.5),color="red", fontsize='small')

T2=text("$W_2$",(-.5,10),color="black", fontsize='small')

T3=text("$W_1$",(10,-.5),color="black", fontsize='small')

T4=text("$Ligne $ de $ $certitude$?",(9,9))

pol=polygon([(0,0), (0,10), (10,10), (0,0)], fill=True, rgbcolor=(0.81,0.81,0.81),ticks=[[], []])

inslin=plot(((b(1-p)-1)/(b(1-p))),(0, 10),color="green",ymin=0,ymax=10)

Lc=line([(0,0), (10,10)], color="black")

L1=line([(8,0), (8,2), (0,2)], linestyle="--")

L2=line([(8,2), (8,8),(0,8)], linestyle="--")

T4=text("$W_0$",(8,-.5),color="black", fontsize='small')

T5=text("$W_0$",(-.5, 8),color="black", fontsize='small')

T6=text("$W_0-x$",(-.75, 2),color="black", fontsize='small')

c=circle((8,2), .075, fill=True, edgecolor='red', facecolor='red')

pol+Lc+T1+T2+T3+T4+L1+L2+T4+T5+T6+c+inslin+g

I wonder

1) whyT4 is not displayed and 2) why inslin is displayed as a horizontal line.

I wonder also if it is possible to write labels, comments ... directly in LaTeX, and if it is possible to rotate T4 and write it on two lines (I have tried align as in an already asked question but it seems not to work.

edit retag flag offensive close merge delete

2 Answers

Sort by » oldest newest most voted
1

answered 2020-04-10 18:54:05 +0200

dsejas gravatar image

updated 2020-04-10 21:07:25 +0200

Hello, @Cyrille!

The first thing I can suggest you is to remove the first line of your code:

var("b, p, w")

This is useless in this particular case, because you don't use those variables in a symbolic way, but in a numerical way, as you can see for the first two of them, when you write

b = 1 # pouvoir de monopole
p = 0.5 # probabilité qu'il ne se produise rien

You are effectively overwriting the variables. The third one, w, is not even used.

For the rest of this answer (specially for the purpose of referring to line numbers), I am assuming that you have already deleted the first line of your code:

Concerning T4, I can see that you have two T4; one is in line 8 of your code:

T4 = text("Ligne de certitude?", (9,9))

while the other is in line 14:

T4 = text("W0", (8,-.5), color="black", fontsize='small')

So, the second T4 is overriding the first one. What you could do is, starting on line 14, rename T4 to T5; then in line 15, rename T5 to T6; in line 16, rename T6 to T7. That should solve your problem.

Concerning inslin, I don't know if this is problem of formatting of your question above, or an actual problem, but I found that you are missing the multiplication symbol after every variable b. Now, I am assuming b is the same variable as in line 1. If it's a function, then the notation is correct, but you forgot to define the function b. You should use another letter, though, because b already has a meaning.

Concerning text rotation, you can indeed do it by using the rotate option for the text command. For example, in order to rotate the text in T4 by an angle of 45 degrees, you can do

T4 = text("Ligne de certitude?",(8.8,9.2), fontsize="small", rotation=45)

Finally, the beauty of Sage is that you can use LaTeX almost anywhere you want. So, for your question is you can render labels and text in LaTeX, you just have to enclose the words with $ symbols. For example, if you would like to write W2 as $W_2$, you just have to replace line 6:

T2 = text("W2", (-.5,10), color="black", fontsize='small')

with the almost identical

T2 = text("$W_2$", (-.5,10), color="black", fontsize='small')

To answer your last question, yes, you can write a text spreading many lines. You simply should add the line break character, which is written as \n, in a text. For example, if you write T1 as

T1 = text('Loteries\n inaccesibles', (3.5,9.5), color='red', fontsize='small')

or even as

T1 = text('Loteries\ninaccesibles', (3.5,9.5), color='red', fontsize='small')

you will get the text written in two lines. You can add as many break lines as you want to a text.

I hope you don't mind, but I would also like to give you a programming advise: Don't mix single quote (') with double quote (") signs. They have the same meaning in Python/SageMath, so you can use them indifferently, but it is considered poor programming style to mix them.

I am writing a version of your code with all these and some other minor modifications. Please check it here. By the way, I didn't find the definition of plot g in your code, so I will work without it; also, I like single quotes. The result should look like this:
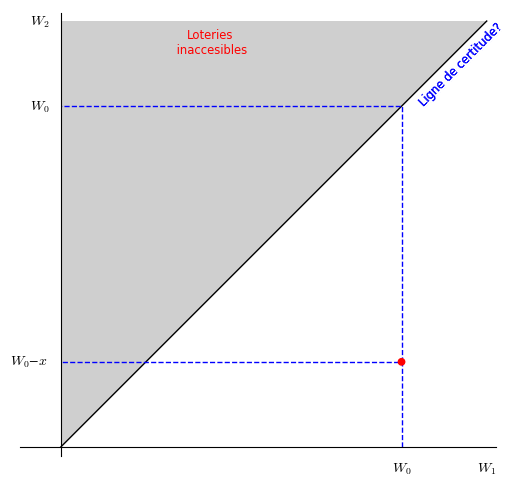
image description

I hope this helps!

edit flag offensive delete link more

Comments

Ok I see the point. But I want also that ligne of certitude be written with the same font than the latex one

Cyrille gravatar imageCyrille ( 2020-04-11 11:04:34 +0200 )edit

I'm not quite sure that I understand what you want, @Cyrille. The text is written in the same font as the math formulas. The only difference is that math formulas are written in italics, and normal text is written in roman style. If you want to write your normal text in italics, you could use the fontstyle='italic' option for the text command. For example,

T4 = text('Ligne de certitude?', (9.4,9), fontsize='small', fontstyle='italic', rotation=45)

If what you want is to write math formulas in roman style (which I strongly recommend not to do), you could write something like

T2 = text('W$_2$',(-.5,10),color='black')

In this case, the "W" will be written as normal text, and only the subscript will be in math mode.

Does that help you?

dsejas gravatar imagedsejas ( 2020-04-12 22:22:19 +0200 )edit
0

answered 2020-04-10 18:08:04 +0200

Cyrille gravatar image

For inslin I have forgotten do declare the variable. So this point is done.

edit flag offensive delete link more

Comments

... and you have two assignments to T4, so you plot the last one

Juanjo gravatar imageJuanjo ( 2020-04-10 18:17:12 +0200 )edit

Your Answer

Please start posting anonymously - your entry will be published after you log in or create a new account.

Add Answer

Question Tools

1 follower

Stats

Asked: 2020-04-10 12:28:26 +0200

Seen: 391 times

Last updated: Apr 10 '20