plot3d method does not properly work with threejs
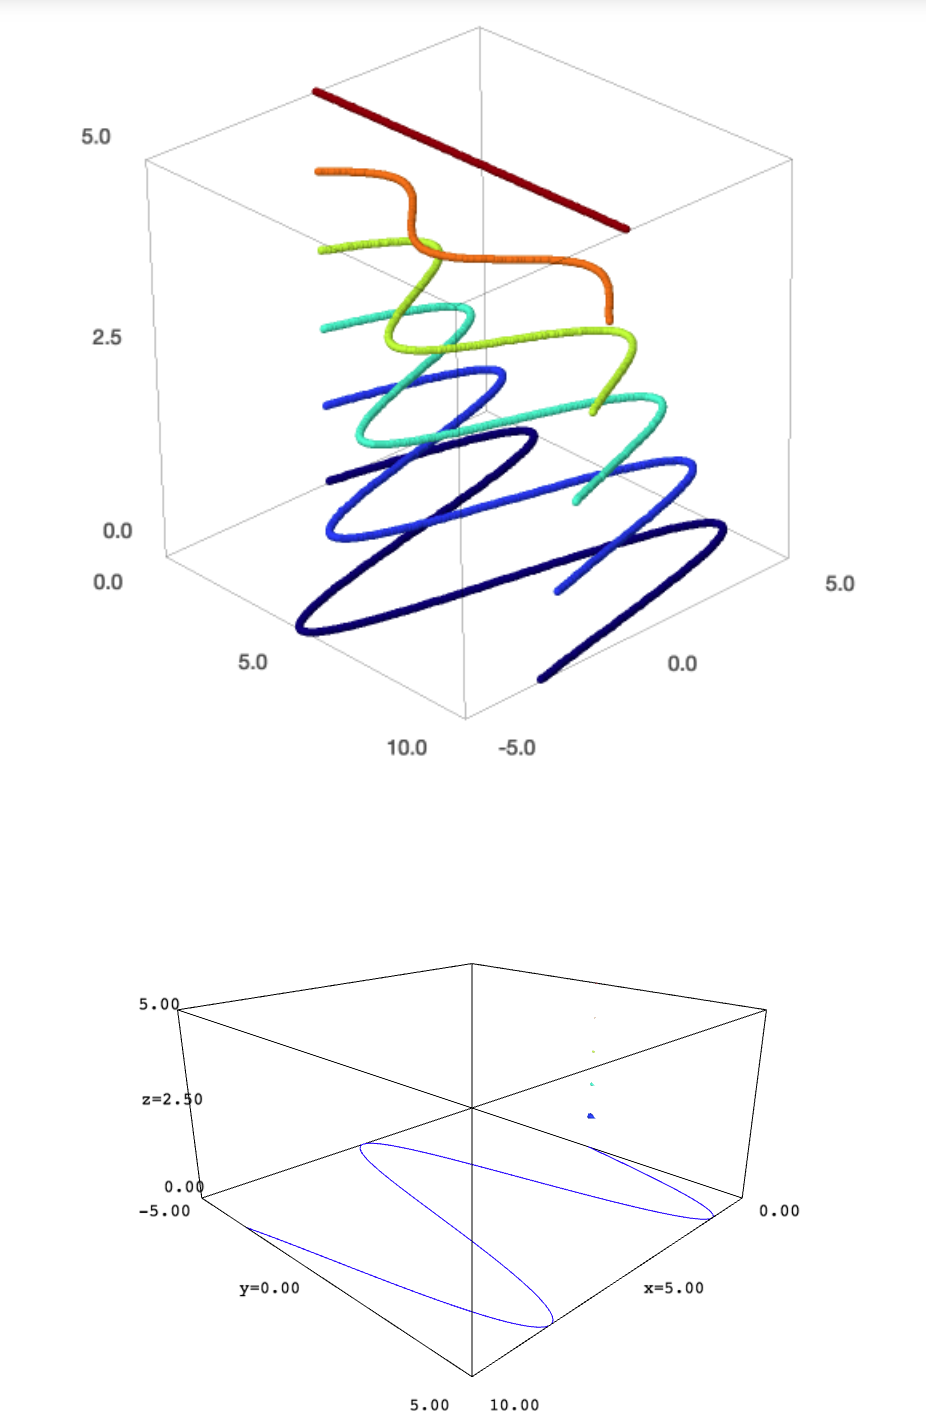
The plot3d method allows to embed 2D objects in 3D graphics. It seems to work properly with the jmol viewer. However, it fails when the viewer is threejs. For example, the code
p = sum(plot((5-k)*sin(x), 0, 10, thickness=10,
             color=colormaps.jet(50*k)).plot3d(z=k) for k in range(6))
show(p, viewer="jmol")
show(p, viewer="threejs")
yields this result:

The first graphic, corresponding to jmol, is correct. The second graphic, produced by threejs, is completely wrong.


Doing
sum(parametric_plot3d([x,(5-k)*sin(x), k], (x, 0, 10)) for k in range(6))gives the same result in both viewers, butthreejsdoesn't seem to like thisthicknessorcolor.Certainly it is possible to search workarounds. But what I just wanted is to draw attention to the fact that the default viewer does not behave properly in the described situation. The example given in the docs (search for plot3d in this page) does not longer work. Perhaps somebody who knows to open trac tickets could add one on this issue.
This is now https://trac.sagemath.org/ticket/29251. Thanks for having reported this bug!
sagemath notebook 9.0 ,OS Ubuntu 18.04 yes threejs do not care about color.
moreover both viewer do not accept 2d vectors
matplotlib() got an unexpected keyword argument 'viewer'
The issue reported in the original question is fixed in the release candidate of SageMath 9.1 (to be out soon).