Loading [MathJax]/jax/output/HTML-CSS/jax.js
Ask Your Question
0

Gridlines, ticks and the like in polar coordinates

asked 5 years ago

JC gravatar image

updated 5 years ago

eric_g gravatar image

Hello to everyone,

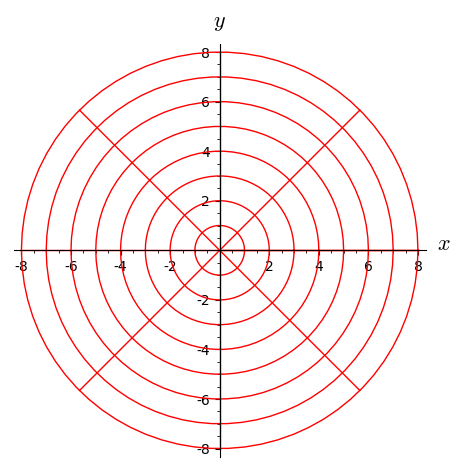
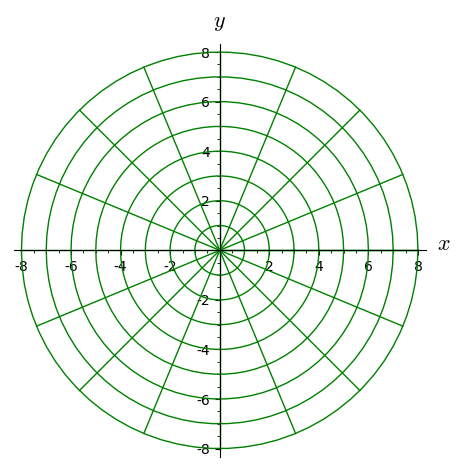
I'd like to produce a polar plot with thecorresponding "polar grid" in it (i.e. the lines corresponding to θ= constant, and the circles r= constant appearing. Also, I would like to have something like the tick markers. I guess I could do something like this manually, but seems very unelegant... An idea?

JC

Preview: (hide)

1 Answer

Sort by » oldest newest most voted
1

answered 5 years ago

eric_g gravatar image

For the gridlines, you can do:

sage: E = EuclideanSpace(2)
sage: polar.<r, theta> = E.polar_coordinates()
sage: polar.plot(E.cartesian_coordinates())

image description

See this page for all plot options. For instance:

sage: polar.plot(E.cartesian_coordinates(), number_values={r: 9, theta: 17}, color='green')

image description

Preview: (hide)
link

Your Answer

Please start posting anonymously - your entry will be published after you log in or create a new account.

Add Answer

Question Tools

1 follower

Stats

Asked: 5 years ago

Seen: 312 times

Last updated: Feb 24 '20