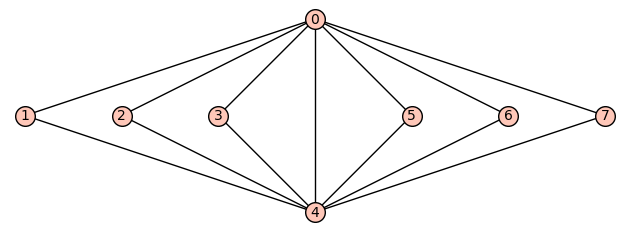
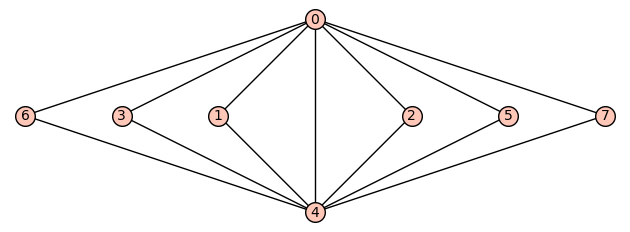
How to draw the following graph in sagemath?
How to draw the following graph in sagemath?
I am uploading the image here:
I know how to draw a graph but I am finding it difficult to draw the graph in exactly the same way as shown in the picture.
Is it possible to do this?
I will be very grateful if someone could kindly help me out


It looks like you've asked the same question on LaTeX Stack Exchange here. LaTeX, through the tkz-berge package, is probably the best way to specify the position to create a diagram.