Ask Your Question
0

How to draw the following graph in sagemath?

asked 2019-10-09 14:27:58 +0200

Captcha gravatar image

updated 2020-06-09 11:29:14 +0200

FrédéricC gravatar image

How to draw the following graph in sagemath?

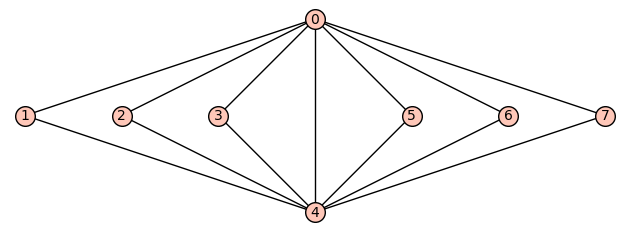
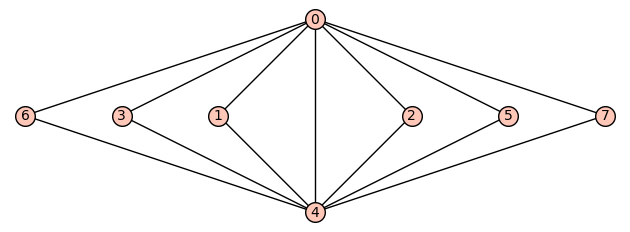
I am uploading the image here:

https://imgur.com/Q3sUXn8

I know how to draw a graph but I am finding it difficult to draw the graph in exactly the same way as shown in the picture.

Is it possible to do this?

I will be very grateful if someone could kindly help me out

edit retag flag offensive close merge delete

Comments

It looks like you've asked the same question on LaTeX Stack Exchange here. LaTeX, through the tkz-berge package, is probably the best way to specify the position to create a diagram.

dazedANDconfused gravatar imagedazedANDconfused ( 2019-10-09 17:15:14 +0200 )edit

2 Answers

Sort by » oldest newest most voted
1

answered 2019-10-09 20:30:23 +0200

Emmanuel Charpentier gravatar image

updated 2019-10-09 20:57:22 +0200

Alternate solution:

sage: G=Graph([[0,u] for u in (1..7)])
sage: G.add_edges([[u,4] for u in (1..3)])
sage: G.add_edges([[u,4] for u in (5..7)])
sage: D={0:[4,2]}
sage: D.update({4:[4,0]})
sage: for u in (1..3): D.update({u:[u,1]})
sage: for u in (5..7): D.update({u:[u,1]})
sage: G.plot(pos=D)

The required graph (approximately...)

EDIT : If you insist on the order of the nodes:

sage: Dpos=[4, 3, 5, 2, 4, 6, 1, 7]
sage: G.plot(pos={u:[Dpos[u], 1+(u==0)-(u==4)] for u in (0..7)})

A better approximation

edit flag offensive delete link more

Comments

You define the same pos dictionary to provide coordinates to the vertices, how is it alternate ?

tmonteil gravatar imagetmonteil ( 2019-10-09 22:44:58 +0200 )edit
1

answered 2019-10-09 17:02:56 +0200

tmonteil gravatar image

updated 2019-10-09 17:11:30 +0200

If G is you graph, you can define coordinates of the vertices by using the set_pos method, see:

sage: G.set_pos?

for more details.

EDIT Having a look at the set_pos documentation, it is actually lacking meaningful examples, so here is how to use set_pos: you have to define a dictionary that associates to each vertex a coordinate (i.e. a tuple of two numbers), as follows:

sage: G = Graph(3)
sage: G.set_pos({0:(0,0), 1:(1,1), 2:(0,1)})
sage: G.plot()
edit flag offensive delete link more

Comments

A better answer can be obtained via a clever use of $\LaTeX$ and Graphviz. See the relevant documentation.

Emmanuel Charpentier gravatar imageEmmanuel Charpentier ( 2019-10-09 21:03:04 +0200 )edit
1

I consider Python/Sagemath a better programming language than LaTeX, so it is easier to produce a graph with Sage and then convert it into latex/tikz, with:

sage: latex(G)

This is especially true for complex graphs.

tmonteil gravatar imagetmonteil ( 2019-10-10 11:27:44 +0200 )edit

Thierry, that's exactly what I thought of ; but my expresson wasn't exactly precise...

Emmanuel Charpentier gravatar imageEmmanuel Charpentier ( 2019-10-13 12:43:28 +0200 )edit

Your Answer

Please start posting anonymously - your entry will be published after you log in or create a new account.

Add Answer

Question Tools

1 follower

Stats

Asked: 2019-10-09 14:27:58 +0200

Seen: 607 times

Last updated: Oct 09 '19