Ask Your Question
2

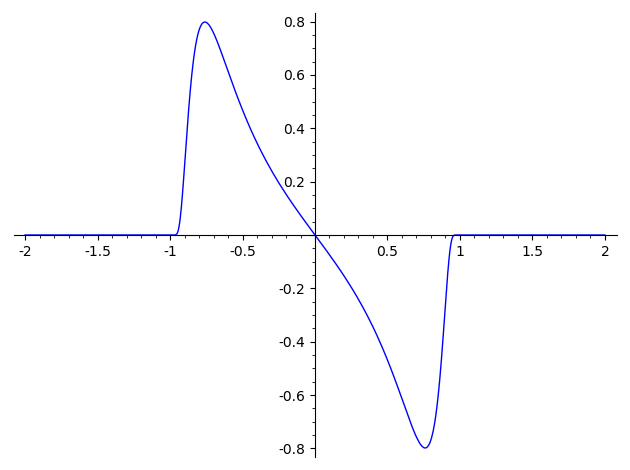
Plotting derivative of bump function

asked 2019-07-15 17:58:12 +0200

alpha0 gravatar image

I wish to plot the derivative of the piecewise function equal to $\exp((1 - x^2)^{-1})$ on (-1, 1) and 0 everywhere else (just as an example). I attempted this by defining to define in sage

f(x) = piecewise([(-oo, -1), 0], [(-1, 1), exp(-1/(1 - x^2)), [(1, oo), 0]]

and then let g = diff(f(x), x)). When i try to evaluate g at various values (for example 0.3), I get 0.333237077156224*(0, 0, 0) + 0.333237077156224, and the number that appears is not only incorrect (in that it is not the derivative it ought to equal), but the expression that appears can't be turned into a single number. My ultimate objective is to obtain plots of various linear combinations of such expressions, so what would be the best way to go about doing this? In addition, what exactly is going on here?

edit retag flag offensive close merge delete

1 Answer

Sort by ยป oldest newest most voted
1

answered 2019-07-16 21:13:00 +0200

rburing gravatar image

This is definitely a bug; I reported it as trac ticket #28207.

As a workaround, you can plot the derivative manually:

sage: f(x) = piecewise([((-oo, -1), 0), ((-1, 1), exp(-1/(1 - x^2))), ((1, oo), 0)])
sage: df(x) = piecewise([((-oo,-1), 0), ((-1,1), diff(exp(-1/(1 - x^2)), x)), ((1,oo), 0)])
sage: plot(df, (x,-2,2))

derivative of bump function

For linear combinations, you can use linearity of the derivative (as a workaround).

edit flag offensive delete link more

Your Answer

Please start posting anonymously - your entry will be published after you log in or create a new account.

Add Answer

Question Tools

1 follower

Stats

Asked: 2019-07-15 17:58:12 +0200

Seen: 418 times

Last updated: Jul 16 '19