Ask Your Question
0

Octave-like plot function, or, how to plot sequence of points?

asked 5 years ago

Hilder Vitor Lima Pereira gravatar image

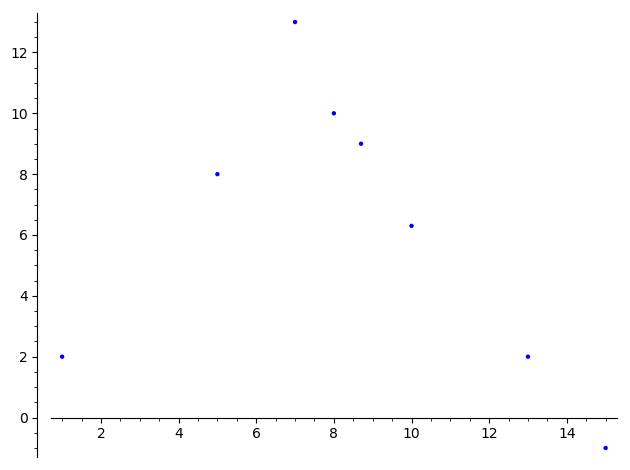
Let's say I have the following set of points: (1, 2), (5, 8), (7, 13), (8, 10), (8.7, 9), (10, 6.3), (13, 2), (15, -1).

I would like to plot a 2D graph passing through them.

In octave, I can do the following:

octave:47> x = [1, 5, 7, 8, 8.7, 10, 13, 15]

octave:48> y = [2, 8, 13, 10, 9, 6.3, 2, -1]

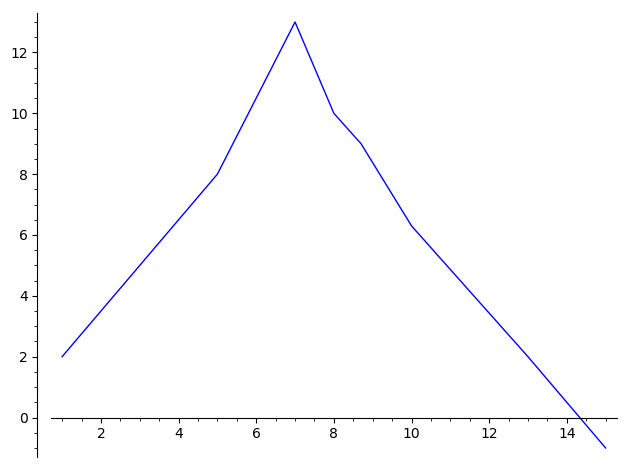
octave:49> plot(x, y)

And I get this graph.

How can I do something similar in sage?

Preview: (hide)

2 Answers

Sort by » oldest newest most voted
2

answered 5 years ago

Juanjo gravatar image

You can use the list_plot function:

x = [1, 5, 7, 8, 8.7, 10, 13, 15]
y = [2, 8, 13, 10, 9, 6.3, 2, -1]
list_plot(zip(x,y), plotjoined=True)

Se the docs for a complete reference.

Preview: (hide)
link
1

answered 5 years ago

Emmanuel Charpentier gravatar image

updated 5 years ago

sage: X = [1, 5, 7, 8, 8.7, 10, 13, 15] sage: Y = [2, 8, 13, 10, 9, 6.3, 2, -1] sage: points(zip(X,Y)) Launched png viewer for Graphics object consisting of 1 graphics primitive

Result

sage: line(zip(X,Y))

image description

Preview: (hide)
link

Your Answer

Please start posting anonymously - your entry will be published after you log in or create a new account.

Add Answer

Question Tools

1 follower

Stats

Asked: 5 years ago

Seen: 493 times

Last updated: Jul 02 '19