Ask Your Question
2

How can I plot error bars for functions?

asked 2019-04-15 15:55:37 +0200

stockh0lm gravatar image

updated 2019-04-15 23:45:55 +0200

So far i plotted an upper and lower bound to my functions (as separate overlayed functions) and I liked that solution a lot. Now a colleague said that error bars were nicer. Can sage plot those? I searched and didnt find any.

The code I use currently is from this helpful comment from rburing: https://ask.sagemath.org/question/454...

edit retag flag offensive close merge delete

Comments

Can you provide code for a function you would like such a plot for?

slelievre gravatar imageslelievre ( 2019-04-15 17:37:00 +0200 )edit

i meant to do so, thanks for the reminder.

stockh0lm gravatar imagestockh0lm ( 2019-04-15 18:40:49 +0200 )edit

1 Answer

Sort by ยป oldest newest most voted
5

answered 2019-04-15 23:37:06 +0200

dsejas gravatar image

updated 2020-04-28 20:33:00 +0200

Hello, @stockh0lm. You ask a very interesting question. I just found a solution, but I don't think it's the most elegant one. I would suggest you to keep looking for another option, but meanwhile...

We are going to mix SageMath plots with pure Matplotlib plots, so you need to import Matplotlib with the line

import matplotlib.pyplot as mpl

I took the following from another of your questions, and made a few changes (the colors and line styles). We will work with this. We are also going to take advantage of your already defined f(), f_lower() and f_upper().

plot([f, f_lower, f_upper],(x,0.2,0.99), color=['blue', 'green', 'green'], linestyle=['-', '--', ':'],
     legend_label=['without error',  'lower margin of error', 'upper margin of error'], 
     axes_labels=['cable\'s burial depth in [m]','Potential in [V]'], 
     figsize=8, axes_labels_size=1, title='$U$ is without error', title_pos=(0.5,1.1)
).matplotlib(figure=mpl.gcf())

Note the ".matplotlib(figure=mpl.gcf())" at the end? This is because, as you know, "plot" is a purely SageMath command. So this is a directive to convert it to a Matplotlib-compatible figure. In particular, saying "figure=mpl.gcf()" indicates to add this plot to the current graphic (gcf="get current graphics").

You'll probably need to adjust the axis ranges a little bit to make a more elegant figure. In this case, after some try-and-error, I figured this will make it:

mpl.axis([0.2, 1.1, 0.21, 0.37])

Now we are going to create some lists for the $x$ and $y$ coordinates of the error, and the lower and upper length of the bars:

xx = [] # this will contain the $x$ coordinate
yy = [] # this will contain the $y$ coordinate
el = [] # the lower length of the error box
eu = [] # the upper length of the error box

Now we will fill them. I am assuming that your $x$-axis is from 0.2 to 1.0, and I will use a step of 0.1: for i in range(2, 11): t = 0.1 * i v = N(f(t)) # I use the function N() to convert to RIF to float xx += [t] yy += [v] el += [v - f_lower(t)] eu += [f_upper(t) - v]

Now we use the errorbar() function from Matplotlib:

mpl.errorbar(xx, yy, [el, eu], ecolor='r', elinewidth=1, marker='s', fmt=' ')

Note there is a space between the last quotation marks. This es in order to ask Matplotlib to only draw the error bars and not the lines linking them, since we don't want lines, but the the original function, which we plot next. The argument "ecolor" defines the color of the error bars (b = "blue"), the "elinewidth" define its thickness, and the "marker" indicates a marker for the location of the error bar (s = "square").

Now you have to plot it, not using SageMath, but Matplotlib:

mpl.savefig('Error_bars.png')

That's it! Phew. Quite cumbersome, but effective. The result should look like follows, but you can adjust it at your convenience. image description

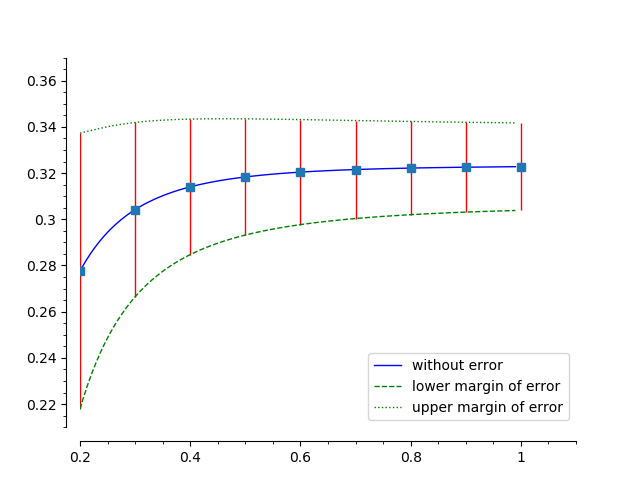
You can read more about Matplotlib's errorbar() here. You can check a mix of my code with yours (the one that produced the image) here.

Best regards!

edit flag offensive delete link more

Comments

wow, thank you for your comprehensive answer!

stockh0lm gravatar imagestockh0lm ( 2019-04-15 23:44:58 +0200 )edit

of course i now want to incorporate this style of plot into the graphics array i just created. However, i am not sure how to have mpl return a figure object that i can append(l), to adjust y-axis etc and decorate it etc. How is that possible? can the x-axis be scaled in this kind of plot?

stockh0lm gravatar imagestockh0lm ( 2019-04-16 22:53:40 +0200 )edit

I am not completely sure what you mean. Do you want to add this plot as a subplot in a figure?

dsejas gravatar imagedsejas ( 2019-04-17 01:24:46 +0200 )edit

No, i want to add this plot as part of the mega plot created in this answer: https://ask.sagemath.org/question/461...

stockh0lm gravatar imagestockh0lm ( 2019-04-17 07:21:27 +0200 )edit

i tried to use l.append(p) and l.append(mpl.gcf()), but those objects dont have the attribute get_minmax_data anymore. So i guess i cant rescale them anymore like it is needed to create the equally scaled graphics_array in my other question. That would mean i cant easily combine this and the other plot type, can I?

stockh0lm gravatar imagestockh0lm ( 2019-04-17 07:55:00 +0200 )edit

I think you could still do it, but only in the loop after all the plots are plotted, in the little python matplotlib part that you created there, after the yM and ym are known already. (Or alternatively I would have to use the mpl equivalents of ymin and ymax.)

stockh0lm gravatar imagestockh0lm ( 2019-04-17 08:05:43 +0200 )edit

Actually, it is possible to use the get_minmax_data() method. You have to do it before converting the plot to Matplotlib format. For example, in the second code fragment of my answer, instead of doing plot(...).matplotlib(figure=gcf()), you can do p=plot(...), then l.append(p), then compute ym and yM using get_minmax_data() as you did before. I imagine this solves it? Please, let me know.

dsejas gravatar imagedsejas ( 2019-04-17 16:39:32 +0200 )edit

Hello, @stockh0lm. Did you finally solved this last problem? If it's solved could you please mark the another related question as answered? This way others can find the answer quickly.

dsejas gravatar imagedsejas ( 2019-04-21 05:25:08 +0200 )edit

i got distracted by some urgent, related problems. i will come back to this and mark this answered.

stockh0lm gravatar imagestockh0lm ( 2019-04-21 16:44:30 +0200 )edit

actually i run into problems when trying to adapt your solution to the subplot solution in the other answer. Comments are not very good for exchanging this amount of information.

this is how i inserted your code: http://paste.debian.net/1080283/

and i got this pic:https://drive.google.com/file/d/1lungXkFGTEDIaUJomy98ErBvYRrsDKzq/view?usp=sharing

stockh0lm gravatar imagestockh0lm ( 2019-04-27 23:05:22 +0200 )edit

Hello, @stockh0lm. I can suggest you three things (my understanding is that the error bars are not correctly plotted.):

  1. mpl.errorbar(xx, yy, [el, eu], ecolor='r', elinewidth=1, marker='s', fmt=' ') should not be part of the inner for loop. (Actually, this is not a suggestion; you should put in on the outer loop. Otherwise, you are plotting too many times the same thing, which is quite inneficient.)
  2. You could put mpl.axis([0.2, 1.1, ym, yM]) right before mpl.errorbar(xx, yy, [el, eu], ecolor='r', elinewidth=1, marker='s', fmt=' '). Check here. (I didn't know about this pasting service! It has a three-day expiration)
  3. If none of this works, you could send me the complete code that generates this image, and I could try to find a solution
dsejas gravatar imagedsejas ( 2019-04-28 02:14:59 +0200 )edit

If your code should remain private, let me know, so I can send you a private link with expiration date for you to upload it.

dsejas gravatar imagedsejas ( 2019-04-28 02:28:46 +0200 )edit

my code does not need to stay private. You can set the expiration to never, too. I just use it frequently for sentimental reasons.

I want to express my thanks to you and your dedication to helping the community and me, specifically. You go above and beyond what is to be expected, and that with excellence and friendliness. I would have liked to write to you in private to say this, but i didnt see how this site allowed for that. so there. :-)

stockh0lm gravatar imagestockh0lm ( 2019-04-28 16:46:50 +0200 )edit

https://drive.google.com/drive/folder...

here is my code. i changed it like you suggested (i think) but now it plots just one error bar per pic and the last plot is funny.

stockh0lm gravatar imagestockh0lm ( 2019-04-28 17:00:09 +0200 )edit

Your Answer

Please start posting anonymously - your entry will be published after you log in or create a new account.

Add Answer

Question Tools

2 followers

Stats

Asked: 2019-04-15 15:55:37 +0200

Seen: 852 times

Last updated: Apr 28 '20