Arrow length goes wild near poles in vector field plot
Running this piece of code
x, y = var('x y')
f = 1/sqrt(x^2 + y^2)
grad = f.gradient([x, y])
plot_vector_field(grad, (x, -1, 1), (y, -1, 1)).show()
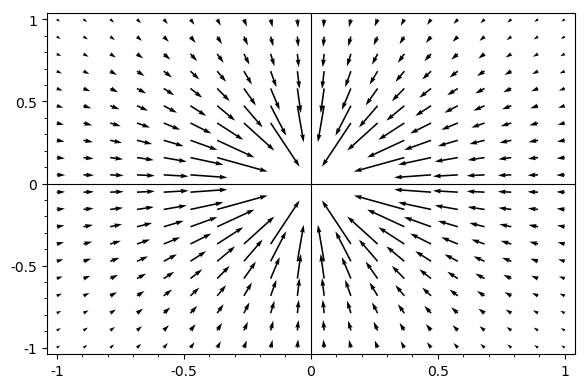
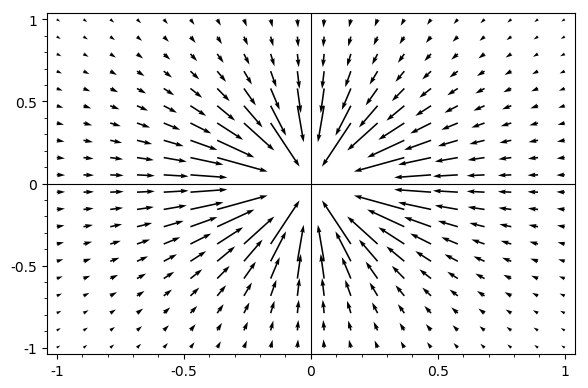
gives me this

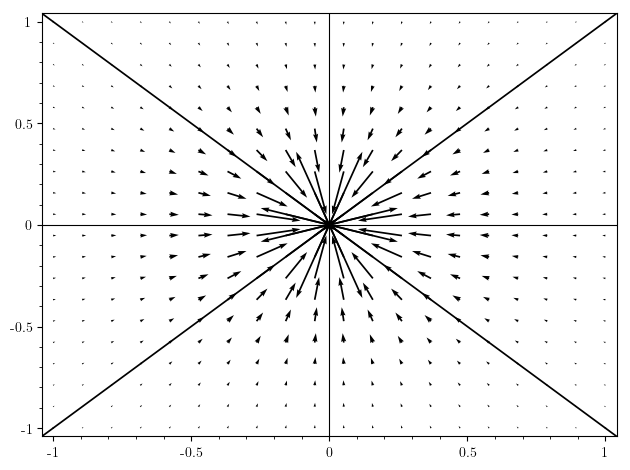
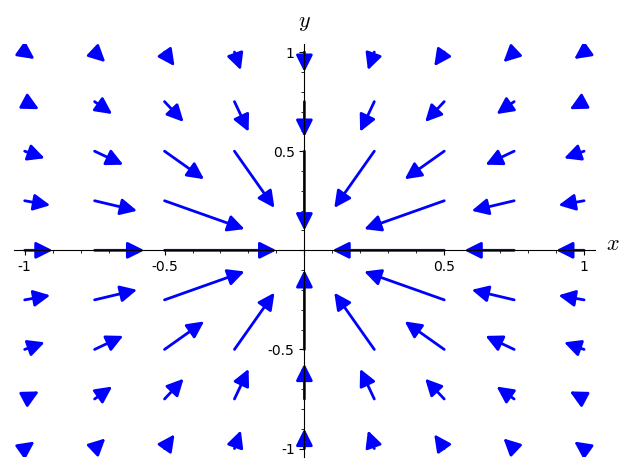
As you can see the arrows very close to the pole "cross out" the whole pic. Obviously they are very large vectors, but they do harm the overall image. I have other plots where its worse. How can I work around that? Can I blank out the direct proximity of the pole, somehow? Can I limit the vectors' length? How?


