Processing math: 100%

First time here? Check out the FAQ!

Ask Your Question
1

Cannot solve differential equation (Lane-Emden equation) numerically

asked 6 years ago

John Bao gravatar image

updated 6 years ago

Hi, my friends,

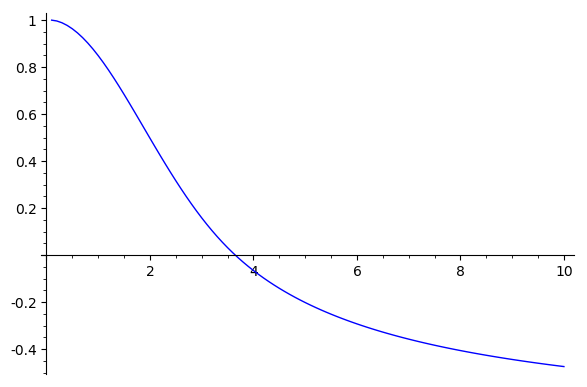
I tried to solve Lane-Emden equation, as model of white dwarf,

d2xdt2+2tdxdt+xn=0,    where    n=32

and I have some troubles in sagemath.

I am using following code:

T = ode_solver()
def f_1(t,y): return [y[1],-2/t*y[1]-y[0]^(3/2)]
T.function = f_1
def j_1(t,y): return [[0, 1], [-3/2*y[1]^(1/2), -2/t], [0,2*y[1]/t^2]]     #Jacobian matrix
T.jacobian = j_1
T.algorithm = "rk8pd"
T.ode_solve(y_0=[1,0], t_span=[0,10], num_points=1000)
f = T.interpolate_solution()
plot(f, 0, 10)

Above code is very similar of the example in sagemath reference: Van der Pol equation

Both equations (Lane-Emden and Van der Pol) are non-linear differential equation, therefore, are not easy to solve.

I don't know where comes to problem in above codes, can someone give me a help?

John

Preview: (hide)

1 Answer

Sort by » oldest newest most voted
1

answered 6 years ago

rburing gravatar image

updated 6 years ago

I don't know how to fix that code, but as an alternative you can use desolve_system_rk4:

var('y0 y1 t')
ode_rhs = [y1, -2/t*y1 - y0^(3/2)]
points = desolve_system_rk4(ode_rhs,[y0,y1],ics=[0.1,1,0],ivar=t,end_points=10,step=0.1)

To plot y0 (i.e. x) against t:

ty0_points = [ [i,j] for i,j,k in points]
list_plot(ty0_points, plotjoined=True)

t,y0-plot

To plot the curve in the (y0,y1)-plane (together with the vector field):

y0y1_points = [ [j,k] for i,j,k in points]
list_plot(y0y1_points, plotjoined=True, color='red') + sum(arrow2d(p[1:], vector(p[1:]) + vector([eqn_rhs.subs({t : p[0], y0 : p[1], y1: p[2]}) for eqn_rhs in ode_rhs]).normalized()*0.03,arrowsize=1,color='blue') for p in points if p[1] >= 0)

y0,y1-plot

The vector field only makes sense when y0 >= 0 (same for the ODE and its "solution" plotted above). I don't know what the solver does past that point; I wouldn't trust it.

Preview: (hide)
link

Comments

Thank you very muchfor you nice answer, Mr. Buring. For the first plot, is there a simple way to find t where y0=0?

John Bao gravatar imageJohn Bao ( 6 years ago )

You're welcome. You can do min(ty0_points,key=lambda (t,y0): abs(y0)) to find a pair (t,y0) where y0 is minimal in absolute value. To get a better approximation, you can make the step size smaller.

rburing gravatar imagerburing ( 6 years ago )

Your Answer

Please start posting anonymously - your entry will be published after you log in or create a new account.

Add Answer

Question Tools

1 follower

Stats

Asked: 6 years ago

Seen: 455 times

Last updated: Mar 07 '19