Ask Your Question
2

plots of complex numbers

asked 7 years ago

Boston gravatar image

updated 7 years ago

tmonteil gravatar image

Say I want to plot the 6 solutions of the following complex equation.

What is the best practice?

EDIT by @tmonteil: to lower dependency between Sage services in the long term, here is the code provided in the sagecell:

var('z')
solutions  = solve (z^6==-8, z)
for i in range(0,6):
    show(solutions[i])
Preview: (hide)

3 Answers

Sort by » oldest newest most voted
3

answered 7 years ago

tmonteil gravatar image

updated 7 years ago

The way you solved the equation is such that the solutions are symbolic expressions. It is hard to ask Sage to plot a symbolic expression (unless it represents a function, in which case it will plot its graph).

If the complex numbers are floating-point (e.g. elements of CDF), then plotting the is easily, thanks to the points function:

sage: points([CDF(1+I), CDF(-I), CDF(-2)])

Now, regarding your concrete example, the solutions are given as symbolic expressions representing equalities:

sage: solutions
[z == 1/2*I*sqrt(3)*sqrt(2)*(-1)^(1/6) + 1/2*sqrt(2)*(-1)^(1/6), z == 1/2*I*sqrt(3)*sqrt(2)*(-1)^(1/6) - 1/2*sqrt(2)*(-1)^(1/6), z == -sqrt(2)*(-1)^(1/6), z == -1/2*I*sqrt(3)*sqrt(2)*(-1)^(1/6) - 1/2*sqrt(2)*(-1)^(1/6), z == -1/2*I*sqrt(3)*sqrt(2)*(-1)^(1/6) + 1/2*sqrt(2)*(-1)^(1/6), z == sqrt(2)*(-1)^(1/6)]

So, what you want is to use their right hand side (use the rhs method) and turn them into elements of CDF, so that you can plot them with the points function.

Also, you can notice that when you want to iterate over the elements of a list L, you do not need to use the indexing of the elements, so, instead of typing:

for i in range(len(L)):
    blah L[i]

You can do:

for l in L:
    blah l

In short, you just have to type:

sage: points([CDF(s.rhs()) for s in solutions])

If you want a regular hexagon, you can require the x and y axes to have the same scale with the aspect_ratio option:

sage: points([CDF(s.rhs()) for s in solutions], aspect_ratio=1)

Note also that plots are Sage objects that can be added with eachother, e.g.

sage: points([CDF(s.rhs()) for s in solutions], aspect_ratio=1) + circle((0,0), CDF(8^(1/6)), color='red')

See: this Sage cell
Preview: (hide)
link
3

answered 7 years ago

Sébastien gravatar image

updated 7 years ago

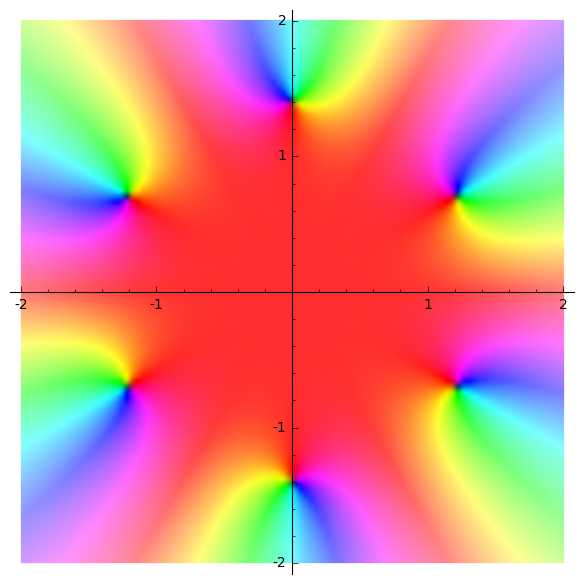
You may also draw a complex plot (black dots are the zeroes, red means real numbers or close to, and other rainbow colors means other argument, more white means high modulus:

sage: var('z')
z
sage: complex_plot(z^6 + 8, (-2,2), (-2,2), aspect_ratio=1)
Launched png viewer for Graphics object consisting of 1 graphics primitive

image description

Preview: (hide)
link

Comments

Note that this is not completely true: the red is more the positive reals, not the reals, since z^6 + 8 and z^6 are real for the same values of z, the real values of the function should be 12 rays emanating from 0, not only the 6 we can guess on the picture, see:

sage: I = CDF.gen()
sage: implicit_plot(lambda x,y : imag((x+I*y)^6+8), (-2,2), (-2,2), aspect_ratio=1)

See this cell

tmonteil gravatar imagetmonteil ( 7 years ago )

Yes, this is what I meant: postive real is red. The best way to confirm the meaning of colors is to plot the identity map:

sage: var('z'); complex_plot(z, (-2,2), (-2,2), aspect_ratio=1)
Sébastien gravatar imageSébastien ( 7 years ago )
1

answered 7 years ago

dan_fulea gravatar image

One possibility is:

sage: var( 'z' );
sage: f = z^6 + 8
sage: list_plot( f.roots(multiplicities=False, ring=CC) )
Launched png viewer for Graphics object consisting of 1 graphics primitive
Preview: (hide)
link

Your Answer

Please start posting anonymously - your entry will be published after you log in or create a new account.

Add Answer

Question Tools

1 follower

Stats

Asked: 7 years ago

Seen: 4,207 times

Last updated: Jan 29 '18