If I correctly understand your question, you want to plot some symbolic function such as $x\mapsto A \sin(wx)$, where $A$ and $w$ are symbolic variables. This is not per se possible since plotting needs floating point values. The solution consists in plotting $x\mapsto \sin(x)$ and changing the labels on the axes. The command
plot(sin(x), (x,-2*pi, 2*pi), ticks = [xt, yt], tick_formatter = [xt_lbl, yt_lbl])
plots the function $x\mapsto \sin(x)$, putting ticks on the x-axis at each location given in the list xt, and ticks on the y-axis using yt. The lists xt_lbl and yt_lbl are the labels at each tick. For instance,
sage: xt = [k * pi for k in range(-2,3)]
sage: xt_lbl = ['$-2\pi/w$', '$-\pi/w$', '$0$', '$\pi/w$', '$2\pi/w$']
sage: yt = [k / 2 for k in range(-2, 3)]
sage: yt_lbl = ['$-A$', '$-A/2$', '$0$', '$A/2$', '$A$']
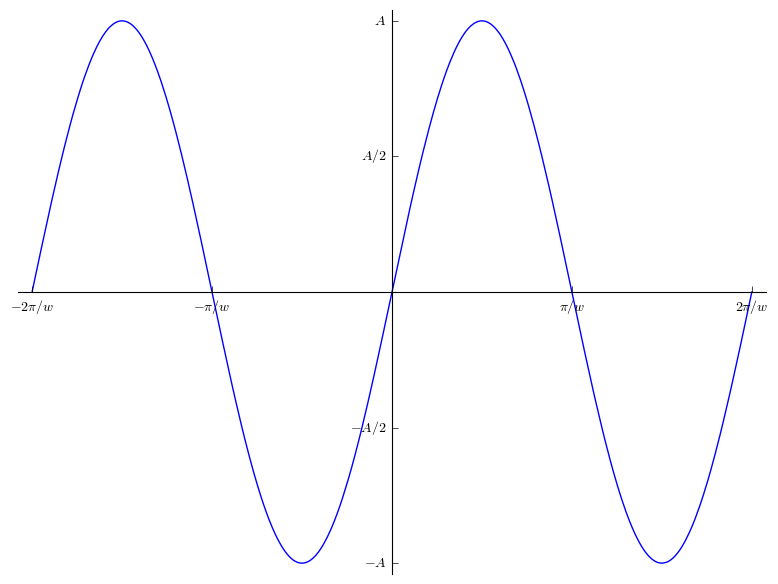
sage: plot(sin(x),(x,-2*pi,2*pi), ticks=[xt, yt], tick_formatter = [xt_lbl, yt_lbl])
Launched png viewer for Graphics object consisting of 1 graphics primitive
creates the following plot:
For more information on ticks and tick_formatter, please refer to the documentation on 2D-plotting (search for "ticks" in the page) and the options of show().
Addendum. You may want to automatize the process a bit more. If you accept to personalize a bit less the labels, this is possible: you can use SageMath's capabilities in the simplification of symbolic expressions, combined with the function latex which produces a LaTeX output from an expression. The following example should be self-explanatory.
sage: xt = [k * pi for k in range(-2, 3)]
sage: yt = [k/2 for k in range(-2, 3)]
sage: var('w,A')
(w, A)
sage: xt_lbl = ['$' + latex(t/w) + '$' for t in xt]
sage: yt_lbl = ['$' + latex(A*t) + '$' for t in yt]
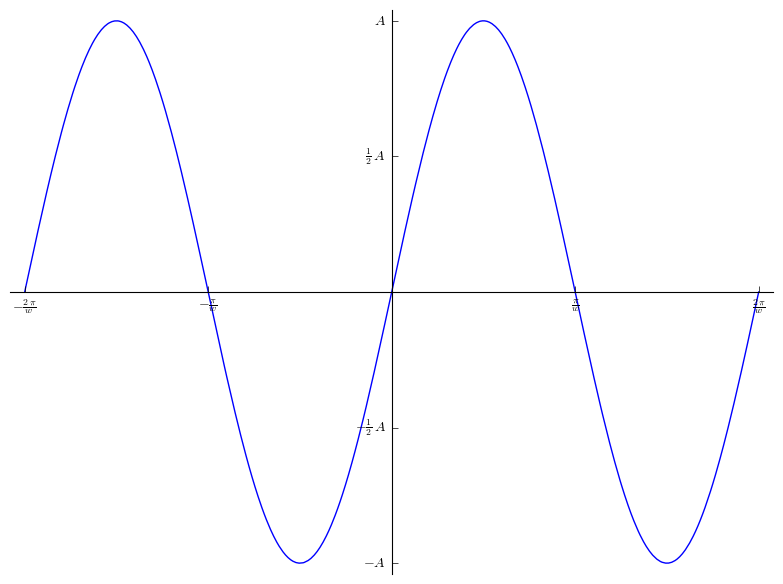
sage: plot(sin(x),(x,-2*pi, 2*pi), ticks=[xt, yt], tick_formatter=[xt_lbl, yt_lbl])
Launched png viewer for Graphics object consisting of 1 graphics primitive

Please give the mathematical description of the task. (To plot something, one needs to evaluate to a real number a function, so there should be no variables as obstacles for the plot around.)
So we first fix parameters $w,A$, and need a 2D-plot of the function of one variable, $x$, given by the formula $$ f(x) = A\sin(wx)\ ,$$ or we fix (and give) a variable $A$, and need a $3D$-Plot of the function $$g(x,w)=A\sin(wx)\ ,$$ or something related...?!
The "ticks" are only simple marks on the coordinate axes?
Hi Dan, thanks for your reply. The first option you gave was the situation I was trying to describe: Fix parameters w, A and get a 2D-plot of the function of variable x.
And yes the tics I'm referring to are simple marks on the coordinate axes -I'm using gnuplot terminology there.
I know you could do this trivially with something like plot(y(x=x, w=2, A=5), (x,-pi(),pi())
But I was interested to see if Sage could plot it without me providing it a specific constant for A and w, but instead using the "assume" operator to define those constants as being real and positive, and plot with the axes expressed in terms of A and w rather than numerically.
Obviously this is just an example, the function I'm dealing with is a bit more complicated.
Does that clarify my question?