Ask Your Question
1

Argand diagram plot

asked 2017-08-20 11:40:07 +0100

ortollj gravatar image

updated 2017-08-20 13:07:22 +0100

HI

T=[-sqrt(1/2*sqrt(13) + 1) - I*sqrt(1/2*sqrt(13) - 1),
 -sqrt(1/2*sqrt(13) + 1) + I*sqrt(1/2*sqrt(13) - 1),
 -sqrt(1/2*sqrt(13) + 1) +I*sqrt(1 + sqrt(13)/2),
 -sqrt(1/2*sqrt(13) + 1) -I*sqrt(1 + sqrt(13)/2) ]

what is the best , fastest, way to plot Argand diagram of T ?
edit retag flag offensive close merge delete

Comments

I edited the array, but imagine the values in the table could be real or complex

ortollj gravatar imageortollj ( 2017-08-20 12:52:50 +0100 )edit

Sorry for this basic question, but I did not succeed I tried this below, without success. Could someone tell me what's wrong ? I wanted to use points(TP):

T=[-sqrt(1/2*sqrt(13) + 1) - I*sqrt(1/2*sqrt(13) - 1),
 -sqrt(1/2*sqrt(13) + 1) + I*sqrt(1/2*sqrt(13) - 1),
 -sqrt(1/2*sqrt(13) + 1) +I*sqrt(1 + sqrt(13)/2),
 -sqrt(1/2*sqrt(13) + 1) -I*sqrt(1 + sqrt(13)/2) ]
TP=[]
for k in range(0,len(T)) :
            TP.append((T[k].real_part(), T[k].imag_part()))
show(TP)
ortollj gravatar imageortollj ( 2017-08-20 17:12:15 +0100 )edit

points(TP) works for me (Sage v8.0). what went wrong?

the function show is also ok and prints a "nice" expression in latex form (use view(TP) to see it rendered).

mforets gravatar imagemforets ( 2017-08-20 17:23:00 +0100 )edit

yes it is also working, Stupidly, I thought my show (TP) was wrong, because I saw trigo formulas in the result !. so I did not even try point(TP) !!!

ortollj gravatar imageortollj ( 2017-08-20 17:44:41 +0100 )edit

3 Answers

Sort by ยป oldest newest most voted
2

answered 2017-08-20 17:14:36 +0100

mforets gravatar image

updated 2017-08-20 17:51:52 +0100

point2d accepts complex arguments:

sage: point2d((CC(Ti) for Ti in T))

it admits a lot of optional parameters, here just some of them are being used:

sage: point2d((CC(Ti) for Ti in T), pointsize=50, marker='x', color='red')

a bunch of arrows can be added using arrow2d:

sage: sum([point2d((CC(Ti))) + arrow2d((0, 0), CC(Ti), color='black') for Ti in T])
edit flag offensive delete link more

Comments

1

Thanks a lot mforets You will not believe it, but I spent more than 1 hour looking how to do it. And no success :)

ortollj gravatar imageortollj ( 2017-08-20 17:27:15 +0100 )edit
3

answered 2017-08-20 19:24:14 +0100

dan_fulea gravatar image

list_plot(T) also does the job.

edit flag offensive delete link more

Comments

Yes list_plot(T) does too ! It's not charitable, Dan_fullea, now I'm ashamed to have opened this post. :(

ortollj gravatar imageortollj ( 2017-08-21 18:09:20 +0100 )edit
0

answered 2020-12-06 07:51:12 +0100

cybervigilante gravatar image

updated 2020-12-06 07:54:04 +0100

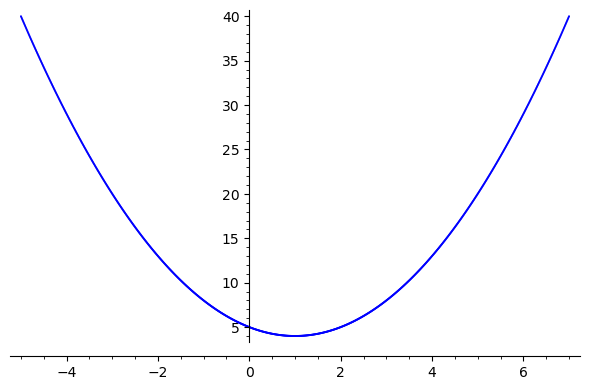
You can use point in a list comprehension for an Argand plane.

var('x')
sqplot = [CC(x + x^2*I - 2*x*I + 5*I) for x in [-5..7,step=.01]]
point(sqplot,size=2)

image description

edit flag offensive delete link more

Your Answer

Please start posting anonymously - your entry will be published after you log in or create a new account.

Add Answer

Question Tools

1 follower

Stats

Asked: 2017-08-20 11:40:07 +0100

Seen: 686 times

Last updated: Dec 06 '20