Ask Your Question
1

How do I print a graph after I find all_graph_colorings?

asked 2017-07-22 19:12:19 +0200

chrisalex0207 gravatar image

updated 2017-07-31 22:10:46 +0200

FrédéricC gravatar image

Code is as follows:

from sage.graphs.graph_coloring import chromatic_number
from sage.graphs.independent_sets import IndependentSets
from sage.graphs.graph_coloring import number_of_n_colorings
from sage.graphs.graph_coloring import first_coloring
from sage.graphs.graph_coloring import all_graph_colorings 
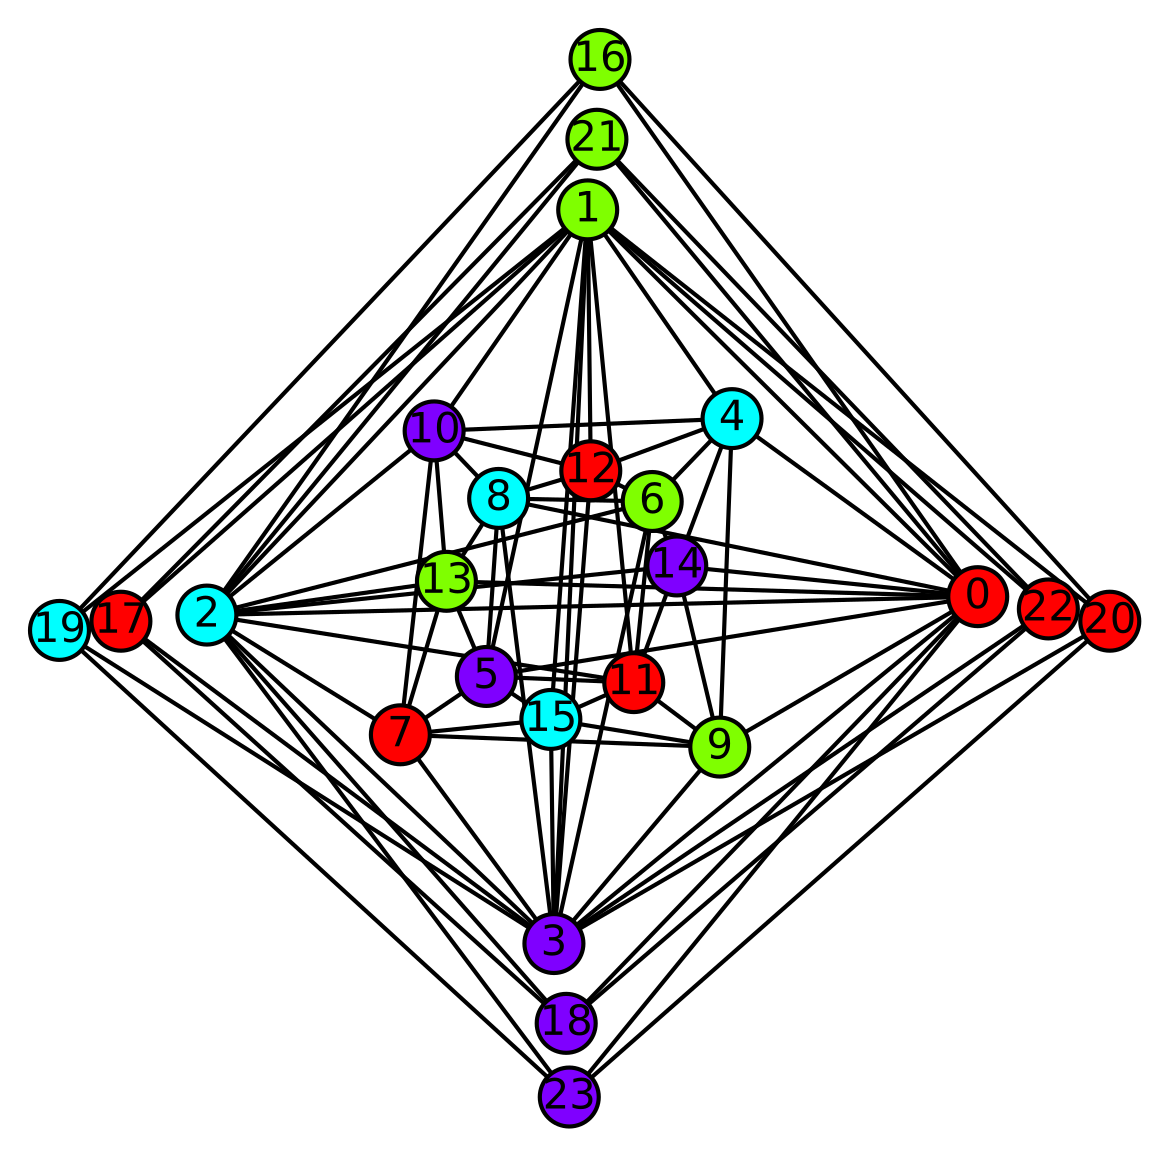
g=Graph([[1, 2], [1, 3], [1, 4], [1, 5], [1, 6], [1, 13], [1, 14], [1, 22], [1, 23], [1, 25], [1, 27], [1, 30], [1, 32], [2, 3], [2, 4], [2, 5], [2, 6], [2, 17], [2, 18], [2, 21], [2, 24], [2, 26], [2, 28], [2, 29], [2, 31], [3, 4], [3, 9], [3, 10], [3, 17], [3, 18], [3, 22], [3, 23], [3, 25], [3, 27], [3, 30], [3, 32], [4, 9], [4, 10], [4, 13], [4, 14], [4, 21], [4, 24], [4, 26], [4, 28], [4, 29], [4, 31], [5, 9], [5, 14], [5, 17], [5, 21], [5, 23], [6, 10], [6, 13], [6, 18], [6, 22], [6, 24], [9, 13], [9, 18], [9, 21], [9, 23], [10, 14], [10, 17], [10, 22], [10, 24], [13, 17], [13, 21], [13, 22], [14, 18], [14, 23], [14, 24], [17, 21], [17, 22], [18, 23], [18, 24], [25, 28], [25, 29], [26, 27], [26, 30], [27, 31], [28, 32], [29, 32], [30, 31]])
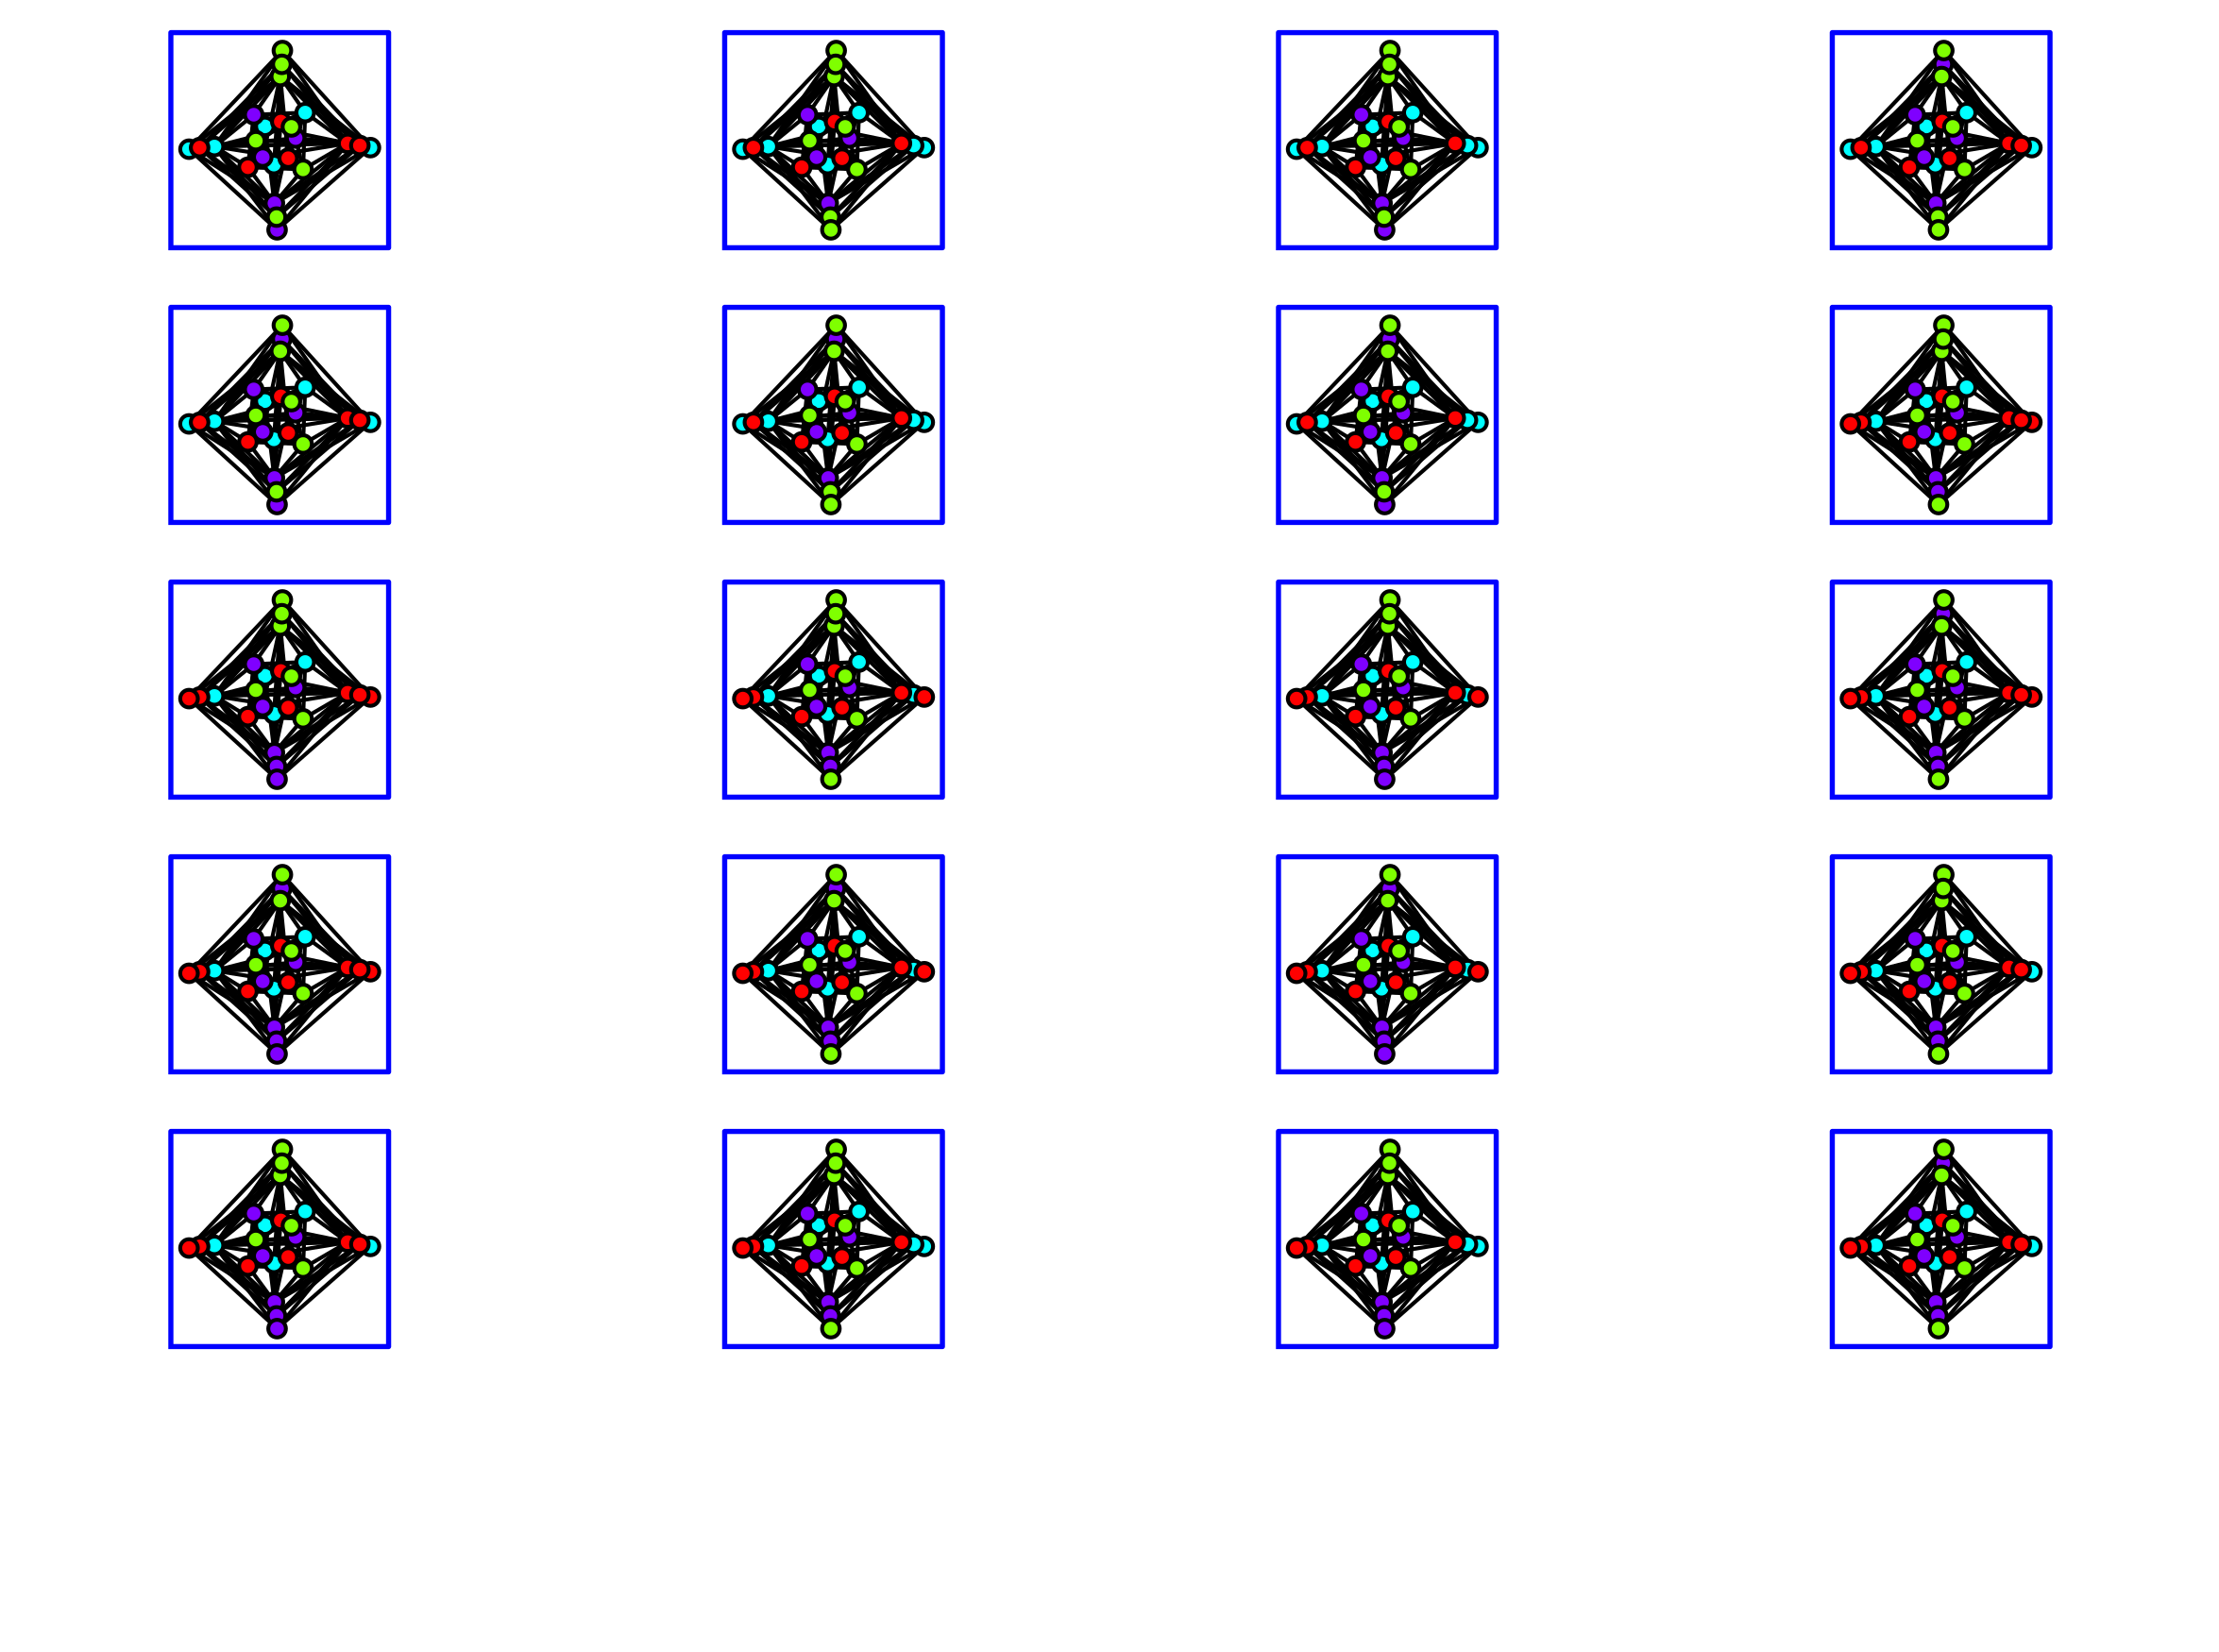
all=all_graph_colorings(g,4)
show(all)

This prints:

<generator object all_graph_colorings at 0x7f1bd8e9c370>
edit retag flag offensive close merge delete

3 Answers

Sort by » oldest newest most voted
2

answered 2017-07-23 21:06:42 +0200

fidbc gravatar image

Very interesting graph.

Just want to complement @vdelecroix's answer. For this purpose the graph has been redrawn (and relabeled as a side effect, sorry!). Here is the new definition of the graph together with the positions for vertices.

g = Graph({0:[1,2,3,4,5,8,9,13,14,16,18,21,23],1:[0,2,3,4,5,10,11,12,15,17,19,20,22],2:[0,1,3,6,7,10,11,13,14,16,18,21,23],3:[0,1,2,6,7,8,9,12,15,17,19,20,22],4:[0,1,6,9,10,12,14],5:[0,1,7,8,11,13,15],6:[2,3,4,8,11,12,14],7:[2,3,5,9,10,13,15],8:[0,3,5,6,10,12,13],9:[0,3,4,7,11,14,15],10:[1,2,4,7,8,12,13],11:[1,2,5,6,9,14,15],12:[1,3,4,6,8,10],13:[0,2,5,7,8,10],14:[0,2,4,6,9,11],15:[1,3,5,7,9,11],16:[0,2,19,20],17:[1,3,18,21],18:[0,2,17,22],19:[1,3,16,23],20:[1,3,16,23],21:[0,2,17,22],22:[1,3,18,21],23:[0,2,19,20]}); g.set_pos({0:[304,171],1:[177,297],2:[53,165],3:[166,58],4:[224,229],5:[144,145],6:[198,202],7:[116,126],8:[148,203],9:[220,122],10:[127,225],11:[192,143],12:[178,212],13:[131,176],14:[206,181],15:[165,131],16:[181,346],17:[25,163],18:[170,32],19:[5,160],20:[347,163],21:[180,320],22:[327,167],23:[171,8]});
color_partitions = all_graph_colorings(g,4)

The way to display a colored graph is to use the partition argument from the plot method, as shown below.

cp = color_partitions.next()
g.show(partition=cp)

A single coloring

Now, if you wish to display several colorings, here is a slight modification of the graphs_list.to_graphics_array method that allows you to display them (this could possibly be further tweaked to get better pictures though).

def plot_next_few_colorings(g,color_partition_iterator,nframes=20):
    plist = []
    for i,color_partition in enumerate(color_partition_iterator):
        plist.append(g.plot(vertex_size=20,partition=cp, vertex_labels=False, graph_border=True))
        if i==nframes-1:
            break
    return graphics_array(plist, ncols=4)

Then plot_next_few_colorings(g,color_partitions) should produce a plot similar to the one shown below.

A few colorings

edit flag offensive delete link more

Comments

Note that successive calls to plot_next_few_colorings will keep on advancing the colorings iterator, that is, it will display different colorings than the previous call.

fidbc gravatar imagefidbc ( 2017-07-23 21:09:12 +0200 )edit
1

Wow! Thank you!

chrisalex0207 gravatar imagechrisalex0207 ( 2017-07-25 01:21:09 +0200 )edit
2

answered 2017-07-22 23:34:17 +0200

vdelecroix gravatar image

The object all as you get as ouptut from graph_colorings is an iterator (can have a look at this stackoverflow post). You can get the colorings one by one using the function next

sage: next(all)
{0: [1, 10, 21, 18, 26, 28, 29, 31],
 1: [2, 14, 9, 22, 25, 27, 30, 32],
 2: [3, 5, 13, 24],
 3: [4, 17, 6, 23]}
sage: next(all)
{0: [1, 10, 21, 18, 26, 28, 29, 31],
 1: [2, 14, 9, 22, 25, 27, 30],
 2: [3, 5, 13, 24],
 3: [4, 17, 6, 23, 32]}

Each time you get a new coloring. The datastructure is a dictionary whose keys are the colors and values are the vertices with the given colors. There is no direct way to get a picture out of it, but this is easy to do using the plotting functions from Sage.

Note that there are > 10000 such colorings... having all of them on one picture might be too much asking for.

edit flag offensive delete link more

Comments

Oh wow! thanks mate!

chrisalex0207 gravatar imagechrisalex0207 ( 2017-07-25 01:21:30 +0200 )edit
0

answered 2017-07-23 02:29:15 +0200

kcrisman gravatar image

Also posted at https://stackoverflow.com/questions/45257476/how-to-graph-all-graph-colorings-in-sagemath (https://stackoverflow.com/questions/4...)

edit flag offensive delete link more

Your Answer

Please start posting anonymously - your entry will be published after you log in or create a new account.

Add Answer

Question Tools

Stats

Asked: 2017-07-22 19:12:19 +0200

Seen: 489 times

Last updated: Jul 23 '17