Wrong arrangement of LaTeX output within bounding box of text plot
When I run the command
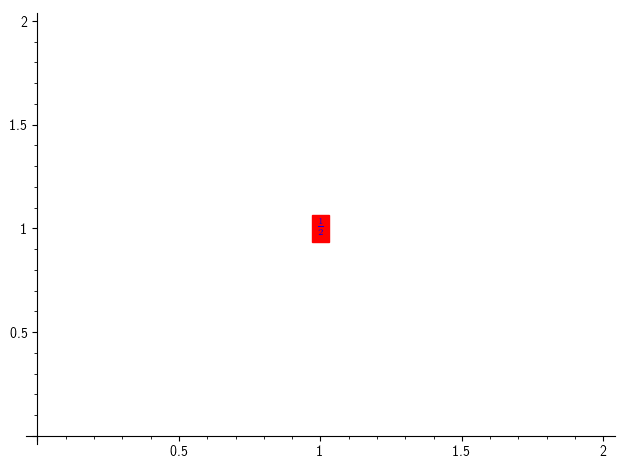
text('$%s$' %latex(1/2),(1,1), background_color='red', typeset='latex')
I get an unsymmetric output of the bounding box. Or more precisely, the fraction is too far above.

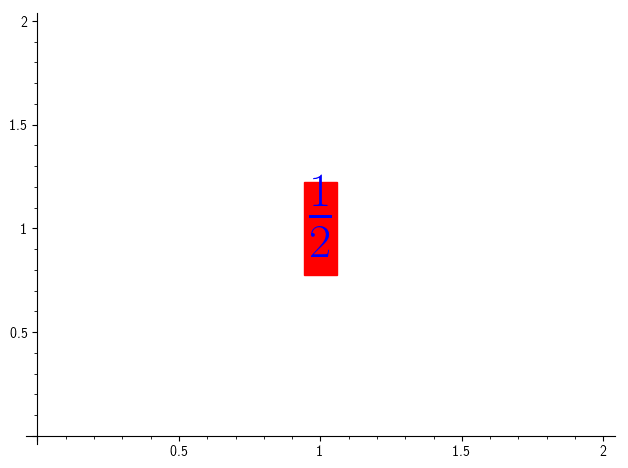
It becomes worse when increasing the fontsize.
text('$%s$' %latex(1/2),(1,1), background_color='red', fontsize=50, typeset='latex')

The fraction line should be further down. This can be reproduced on the Sage cell server: http://sagecell.sagemath.org/?z=eJwdy...
Any ideas how to make it right?
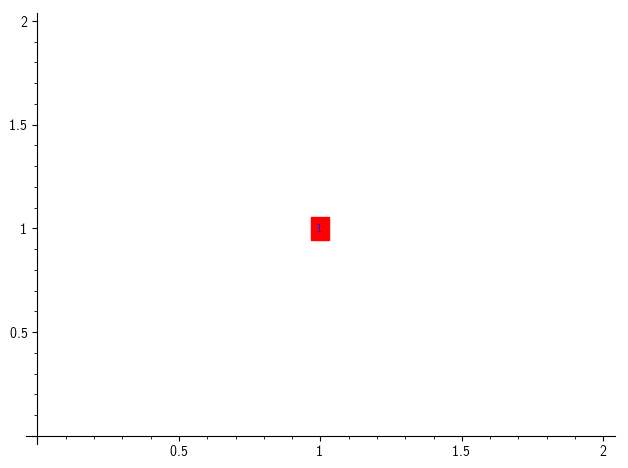
I get a similar problem with
text('$%s$' %latex(1),(1,1), background_color='red', typeset='latex')


I see this in your screenshots, but I can't reproduce this on the Sage cell server: http://sagecell.sagemath.org/?z=eJxzy... Which version of Sage are you using, on which platform?
I changed my matplotlibrc by setting text.usetex to True because I didn't want an asymmetric output of the fraction line as in your example. Look here: http://sagecell.sagemath.org/?z=eJwdz...
I added
typeset='latex'to my code above.'SageMath version 7.6, Release Date: 2017-03-25' on Manjaro (kernel 4.9.33-1).
Thanks for the update - that clarifies a lot.