Ask Your Question
1

Wrong arrangement of LaTeX output within bounding box of text plot

asked 2017-06-19 19:12:23 +0200

Thrash gravatar image

updated 2017-06-19 19:49:36 +0200

When I run the command

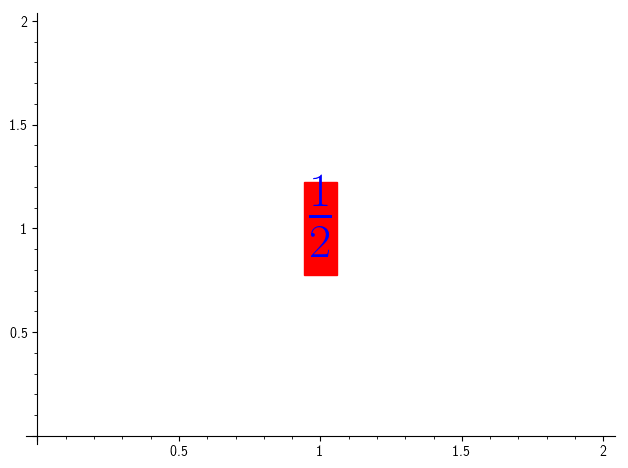
text('$%s$' %latex(1/2),(1,1), background_color='red', typeset='latex')

I get an unsymmetric output of the bounding box. Or more precisely, the fraction is too far above.

image description

It becomes worse when increasing the fontsize.

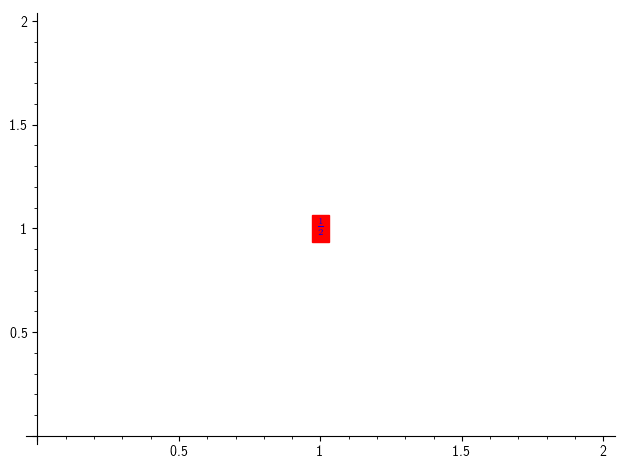
text('$%s$' %latex(1/2),(1,1), background_color='red', fontsize=50, typeset='latex')

image description

The fraction line should be further down. This can be reproduced on the Sage cell server: http://sagecell.sagemath.org/?z=eJwdy...

Any ideas how to make it right?

I get a similar problem with

text('$%s$' %latex(1),(1,1), background_color='red', typeset='latex')

image description

edit retag flag offensive close merge delete

Comments

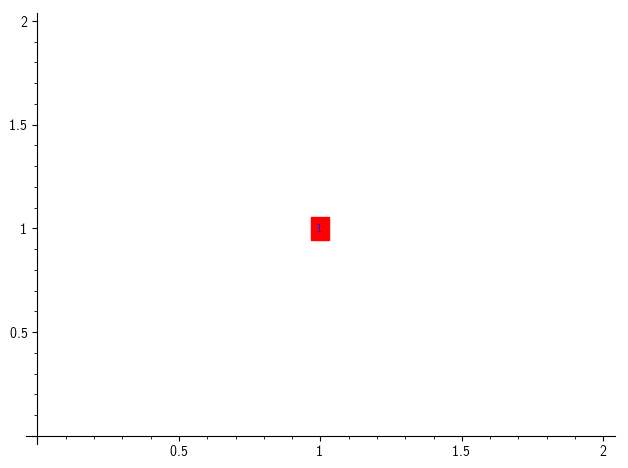
I see this in your screenshots, but I can't reproduce this on the Sage cell server: http://sagecell.sagemath.org/?z=eJxzy... Which version of Sage are you using, on which platform?

kcrisman gravatar imagekcrisman ( 2017-06-19 19:27:12 +0200 )edit

I changed my matplotlibrc by setting text.usetex to True because I didn't want an asymmetric output of the fraction line as in your example. Look here: http://sagecell.sagemath.org/?z=eJwdz...

I added typeset='latex' to my code above.

'SageMath version 7.6, Release Date: 2017-03-25' on Manjaro (kernel 4.9.33-1).

Thrash gravatar imageThrash ( 2017-06-19 19:34:04 +0200 )edit

Thanks for the update - that clarifies a lot.

kcrisman gravatar imagekcrisman ( 2017-06-20 14:47:42 +0200 )edit

1 Answer

Sort by ยป oldest newest most voted
2

answered 2017-06-20 14:56:49 +0200

kcrisman gravatar image

updated 2017-06-21 14:49:47 +0200

Considering that typesetisn't even listed as a supported option at http://doc.sagemath.org/html/en/refer... it's not surprising it doesn't behave as you wish. In particular, we don't require LaTeX as a system dependency (though it is recommended) so we couldn't necessarily support that out of the box for all, though we do have optional doctests and if it were fixed that could be added.

If you know enough matplotlib to mess with it, then see https://github.com/sagemath/sage/blob... and hopefully there might be a way to deal with this in a fashion that "fixes" everything. My guess is that it's a combination of the bounding box options and the clip option, though setting that to True didn't seem to make a difference. My experience does say that a lot of these other options are hard to mix without going directly to matplotlib. Possibly see also Trac 15870.

Edit: This is now Trac 23293.

edit flag offensive delete link more

Comments

1

But typeset is a supported option of show. That means, you can first do a=text(...) and then show(a, typeset='latex').

Thrash gravatar imageThrash ( 2017-06-20 15:56:15 +0200 )edit

Ah! Okay, then this is a bug. Will update momentarily.

kcrisman gravatar imagekcrisman ( 2017-06-21 14:12:46 +0200 )edit

Your Answer

Please start posting anonymously - your entry will be published after you log in or create a new account.

Add Answer

Question Tools

1 follower

Stats

Asked: 2017-06-19 19:12:23 +0200

Seen: 301 times

Last updated: Jun 21 '17