Ask Your Question
1

Drawing Auslander-Reiten quivers with sage possible?

asked 8 years ago

Bern gravatar image

updated 8 years ago

Hi,

I'd like to draw an Auslander-Reiten quiver with sage. I tried to do this by viewing the Auslander-Reiten quiver as a digraph, but, unfortunately, I was not able to find out how to let sage draw both dashed and solid arrows in one digraph.

Is this possible? If not, is there another way to let sage draw Auslander-Reiten quivers?

Any help would be appreciated.

Edit:

I used the following code:
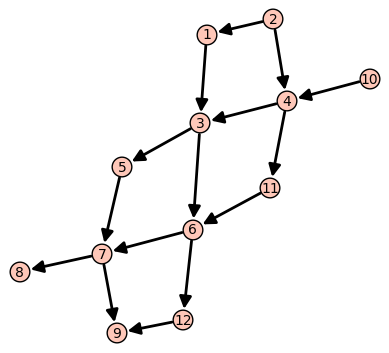
sage: H=DiGraph()

sage: H.add_edges([(2,1),(2,4),(10,4),(1,3),(4,3),(4,11),(11,6),(3,6),(3,5),(5,7),(6,7),(6,12)])

sage: H.add_edges([(7,8),(7,9),(12,9)])

After having typed

sage: H.show()

a few times I got the following output:

pic1

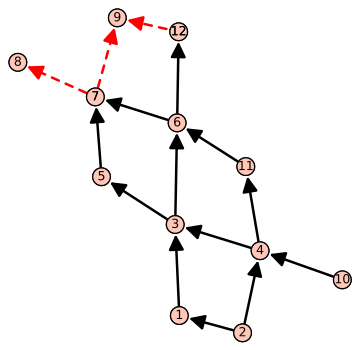
Now, I'd like to draw dahed arrows indicating the Auslander-Reiten translates (e.g. a dashed arrow from 3 to 2).

Preview: (hide)

Comments

Please provide the code you used in your attempts so far. It might be a good starting point for someone to help.

slelievre gravatar imageslelievre ( 8 years ago )

Thank you very much for your comment. I edited the question.

Bern gravatar imageBern ( 8 years ago )
1

Note that vertices of a graph can also be pairs (i,j), that could be very useful here. You can also choose the positions of the vertices using a dictionary. Read the doc: DiGraph?

FrédéricC gravatar imageFrédéricC ( 8 years ago )

@Bern, maybe you can also say how you produce your Auslander-Reiten quiver? And how you use that quiver to choose the edges of your digraph.

slelievre gravatar imageslelievre ( 8 years ago )

It seems like the edge_style attribute for graph plots applies to all edges of a graph.

fidbc gravatar imagefidbc ( 8 years ago )

1 Answer

Sort by » oldest newest most voted
2

answered 8 years ago

fidbc gravatar image

Following the suggestion from @FrédéricC in the comments.

Here is a bit of code that might help.

def draw_quiver(E1,E2):
    H = DiGraph(E1+E2)
    H.layout('spring',save_pos=True)
    H1=DiGraph(solid_edges)
    P1=H1.plot(pos=H.get_pos())
    H2=DiGraph(dashed_edges)
    P2=H2.plot(pos=H.get_pos(),edge_colors={'red':dashed_edges},edge_style='--')
    return P1+P2

Then the following code

solid_edges = [(2,1),(2,4),(10,4),(1,3),(4,3),(4,11),(11,6),(3,6),(3,5),(5,7),(6,7),(6,12)]
dashed_edges = [(7,8),(7,9),(12,9)]
draw_quiver(solid_edges,dashed_edges).show(axes=False)

produces the png displayed below.

image description

Preview: (hide)
link

Comments

Thank you very much for your answer (and sorry for my very late reply). It works perfectly fine! :-)

Bern gravatar imageBern ( 7 years ago )

You are welcome :-)

fidbc gravatar imagefidbc ( 6 years ago )

Your Answer

Please start posting anonymously - your entry will be published after you log in or create a new account.

Add Answer

Question Tools

1 follower

Stats

Asked: 8 years ago

Seen: 577 times

Last updated: Nov 23 '16