Revision history [back]
| | 1 | initial version |

Following the suggestion from @FrédéricC in the comments.
Here is a bit of code that might help.
def draw_quiver(E1,E2):
    H = DiGraph(E1+E2)
    H.layout('spring',save_pos=True)
    H1=DiGraph(solid_edges)
    P1=H1.plot(pos=H.get_pos())
    H2=DiGraph(dashed_edges)
    P2=H2.plot(pos=H.get_pos(),edge_colors={'red':dashed_edges},edge_style='--')
    return P1+P2
Then the following code
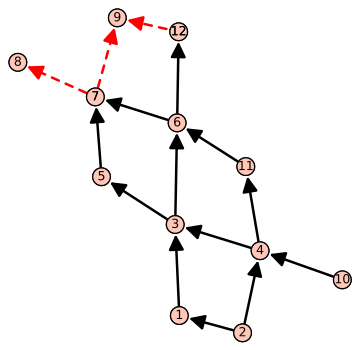
solid_edges = [(2,1),(2,4),(10,4),(1,3),(4,3),(4,11),(11,6),(3,6),(3,5),(5,7),(6,7),(6,12)]
dashed_edges = [(7,8),(7,9),(12,9)]
draw_quiver(solid_edges,dashed_edges).show(axes=False)
produces the png displayed below.