Ask Your Question
2

Is there a way to draw a graph using a specific embedding?

asked 2016-11-11 22:24:18 +0200

jaebond gravatar image

updated 2016-11-12 17:29:03 +0200

It is possible to set the embedding of a graph (set_embedding), but plot() doesn't seem to respect it. Is there a way to plot the graph using the specified embedding?

Here is an example showing that faces() respects the embedding, although plotting each gives the same output:

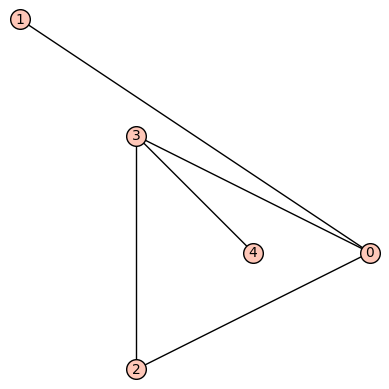
sage: G = Graph({0:[1,2,3], 2:[3], 3:[4]})
sage: G.faces()
[[(0, 1), (1, 0), (0, 2), (2, 3), (3, 4), (4, 3), (3, 0)],
 [(2, 0), (0, 3), (3, 2)]]
sage: G.set_embedding({0:[2,1,3], 1:[0], 2:[0,3], 3:[0,2,4], 4:[3]})
sage: G.faces()
[[(0, 1), (1, 0), (0, 3), (3, 2), (2, 0)],
 [(3, 0), (0, 2), (2, 3), (3, 4), (4, 3)]]
edit retag flag offensive close merge delete

Comments

I would say that there is currently no way in sage to achieve that. You need to code that yourself.

FrédéricC gravatar imageFrédéricC ( 2016-11-12 17:43:25 +0200 )edit

1 Answer

Sort by » oldest newest most voted
2

answered 2016-11-13 02:22:11 +0200

fidbc gravatar image

updated 2016-11-13 02:23:41 +0200

I think you may be able to use the layout flag for plot.

G.plot(layout='planar')

That should respect the embedding you have set. If the embedding is "not planar" an exception is raised.

planar drawing

The full list of plotting options should be listed here.

edit flag offensive delete link more

Comments

I wonder why this does not appear in the doc of G.plot?

tmonteil gravatar imagetmonteil ( 2016-11-13 09:51:54 +0200 )edit

There is a reference to the documentation of the sage.graphs.graph_plot module in the note, but it is not made explicit that there are some "hidden" features there ;-)

fidbc gravatar imagefidbc ( 2016-11-14 22:40:05 +0200 )edit

Your Answer

Please start posting anonymously - your entry will be published after you log in or create a new account.

Add Answer

Question Tools

1 follower

Stats

Asked: 2016-11-11 22:24:18 +0200

Seen: 452 times

Last updated: Nov 13 '16