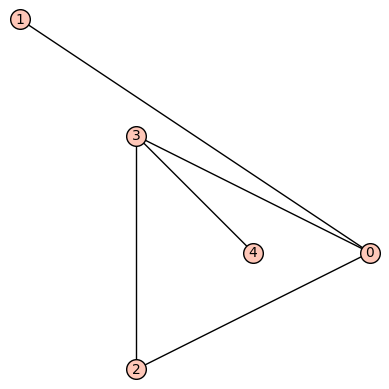
Is there a way to draw a graph using a specific embedding?
It is possible to set the embedding of a graph (set_embedding), but plot() doesn't seem to respect it. Is there a way to plot the graph using the specified embedding?
Here is an example showing that faces() respects the embedding, although plotting each gives the same output:
sage: G = Graph({0:[1,2,3], 2:[3], 3:[4]})
sage: G.faces()
[[(0, 1), (1, 0), (0, 2), (2, 3), (3, 4), (4, 3), (3, 0)],
 [(2, 0), (0, 3), (3, 2)]]
sage: G.set_embedding({0:[2,1,3], 1:[0], 2:[0,3], 3:[0,2,4], 4:[3]})
sage: G.faces()
[[(0, 1), (1, 0), (0, 3), (3, 2), (2, 0)],
 [(3, 0), (0, 2), (2, 3), (3, 4), (4, 3)]]


I would say that there is currently no way in sage to achieve that. You need to code that yourself.