Plot in a function
Hello,
Is it normal that i can't plot in a function ?
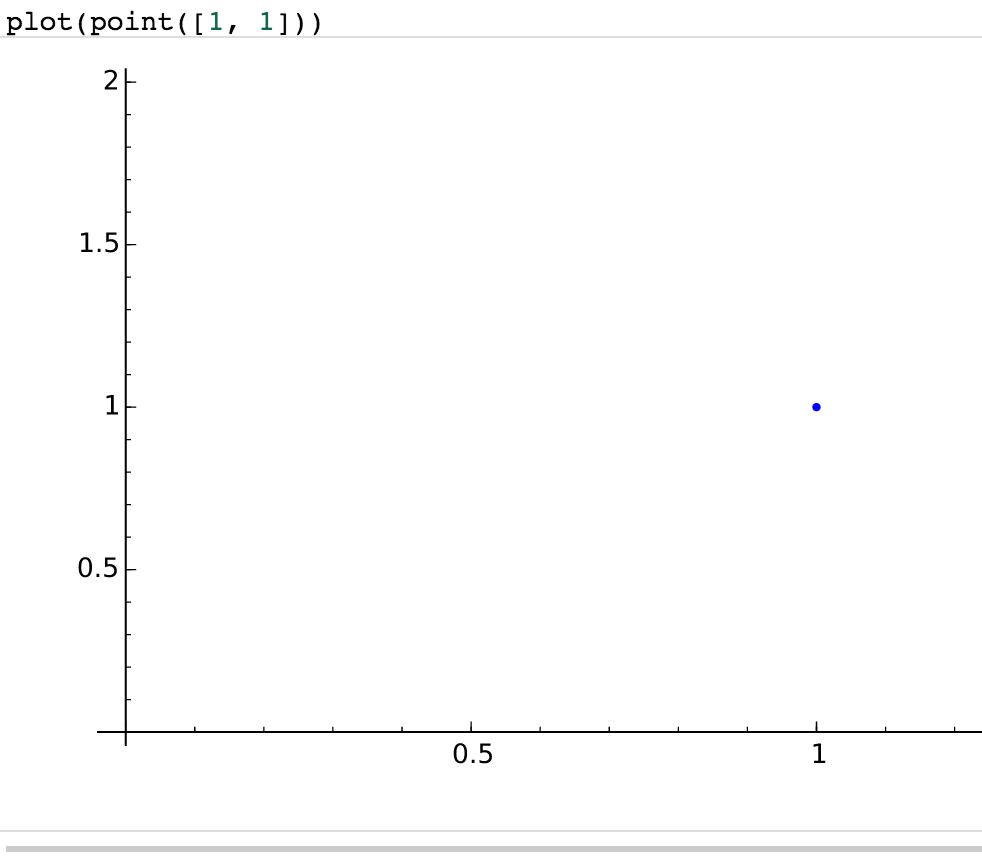
Without a function:
plot(point([1, 1]))
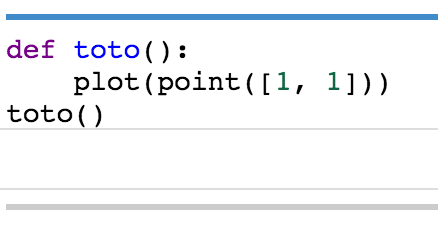
With a function:
def toto():
    plot(point([1, 1]))
toto()
Thanks in advance !
Hello,
Is it normal that i can't plot in a function ?
Without a function:
plot(point([1, 1]))
With a function:
def toto():
plot(point([1, 1]))
toto()
Thanks in advance !
First of all in your code you can replace plot(point([1,1])) by point([1,1]).
And the answer is yes. All plot functions return a graphic objects that can be further manipulated. In your function you are creating a graphic but not using it at all. The following code shows what is a graphic
sage: G = point([1,1])
sage: type(G)
<class 'sage.plot.graphics.Graphics'>
sage: G    # will show the graphics
If you want that your function shows the graphic you can do
def my_graphic():
    G = point([1,1])
    G.show()
If you want that your function returns a graphic you can do
def my_graphic():
    G = point([1,1])
return GThanks ! If I call several times the function, how can I concatenate the graphics to show them in one graph ?
Just use addition
sage: point([1,1]) + point([3,2])Asked: 9 years ago
Seen: 1,063 times
Last updated: Dec 23 '15
 Copyright Sage, 2010. Some rights reserved under creative commons license. Content on this site is licensed under a Creative Commons Attribution Share Alike 3.0 license.
Can you provide the code you used?
All the code is in the pictures. :(
It is better to write the code instead of providing picture. If I want to try the code it is simpler for me to do a copy paste... that is not possible with pictures.
Sorry, I have edited my post.