Precision plots - How do I do those?


Hi.
I have a function which varies so slowly, that in the range I'm interested only the 17th decimal changes.
The sws is this:
sage: mp = 139570180.
sage: mm = 105658371.5
sage: mn = 1.
sage: dmp = 350.
sage: dmm = 3.8
sage: dmn = 0.1
sage: l(a,b,c) = a^2 + b^2 + c^2 - 2*( a*b + b*c + c*a )
sage: f(x) = sqrt(l(mp^2, mm^2, x^2))/(2*mp)
sage: R=RealField(100)
sage: g = fast_callable(f, vars=[x], domain=R)
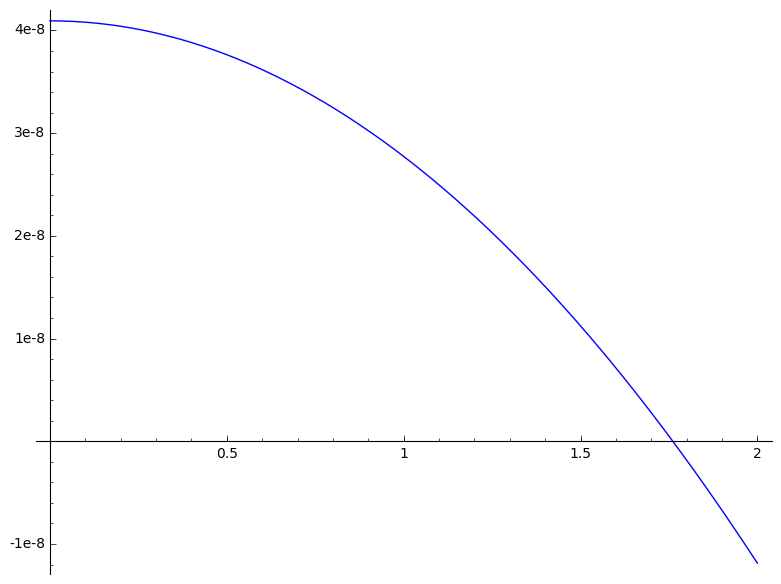
sage: plot( g, (x,0,2))
but I got the following plot, which is unsatisfactory in several ways!
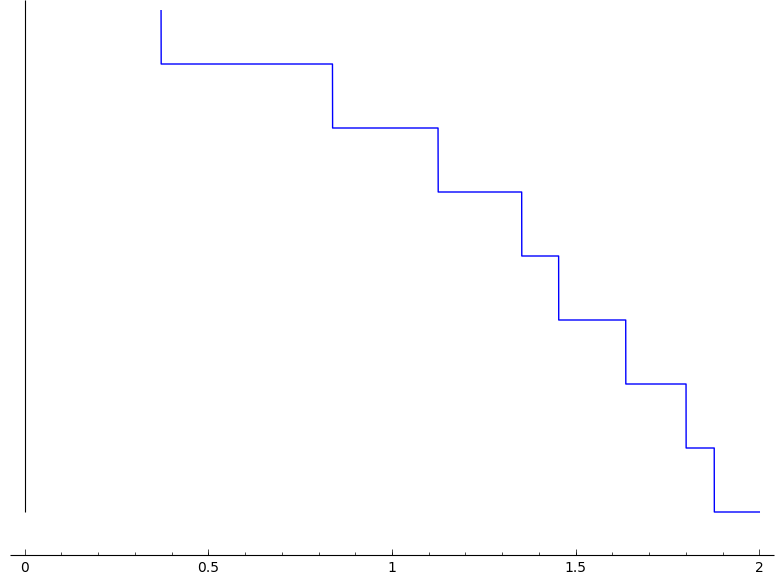
How could I possible improve it? (ticks on vertical axis, a "continuous" line, ...)
Thank you!
add a comment