Ask Your Question
1

Precision plots - How do I do those?

asked 2015-08-20 21:17:53 +0100

Dox gravatar image

updated 2017-01-08 12:20:23 +0100

FrédéricC gravatar image

Hi.

I have a function which varies so slowly, that in the range I'm interested only the 17th decimal changes.

The sws is this:

sage: mp = 139570180.
sage: mm = 105658371.5
sage: mn = 1.
sage: dmp = 350.
sage: dmm = 3.8
sage: dmn = 0.1
sage: l(a,b,c) = a^2 + b^2 + c^2 - 2*( a*b + b*c + c*a )
sage: f(x) = sqrt(l(mp^2, mm^2, x^2))/(2*mp)
sage: R=RealField(100)
sage: g = fast_callable(f, vars=[x], domain=R)
sage: plot( g, (x,0,2))

but I got the following plot, which is unsatisfactory in several ways!
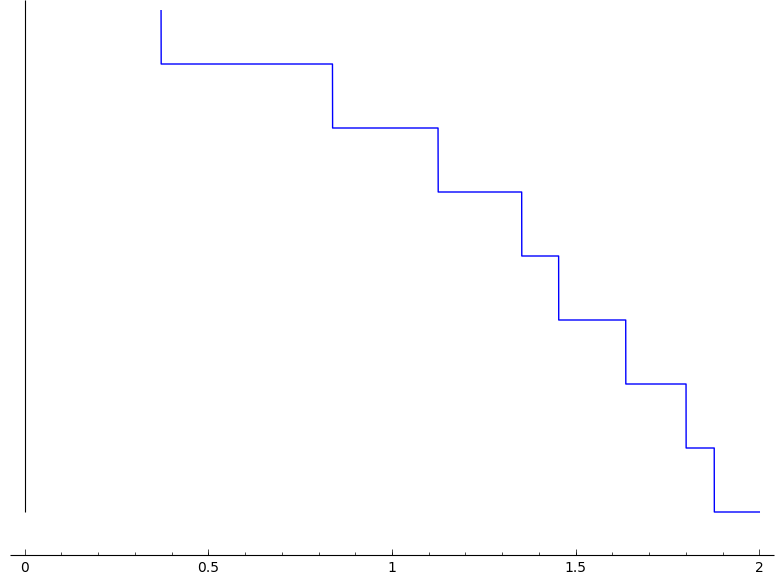
image description

How could I possible improve it? (ticks on vertical axis, a "continuous" line, ...)

Thank you!

edit retag flag offensive close merge delete

1 Answer

Sort by » oldest newest most voted
3

answered 2015-08-22 12:50:57 +0100

tmonteil gravatar image

updated 2015-08-22 15:14:52 +0100

I did not check further, but i would say that the plot function is using matplotlib and that the latter uses double floating-point numbers (with 53 bits of precision). So, what i temporarly suggest is to shift your finction as follow to get more precision:

sage: ff(x) = f(x)-2.97919787636599e7
sage: g = fast_callable(ff, vars=[x], domain=R)
sage: plot( g, (x,0,2))

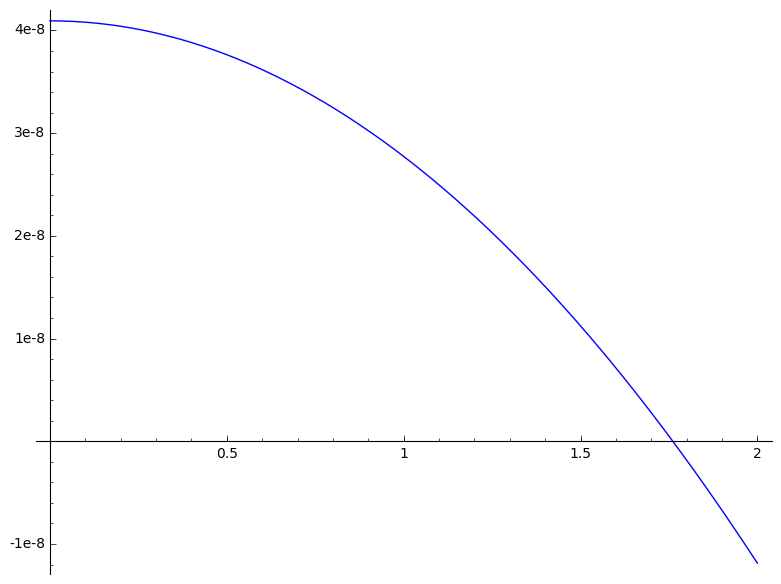
This workaround solution is not completely satisfactory, but at least, you will get something much rounder:

smooth_plot.png

edit flag offensive delete link more

Comments

@tmonteil Thank you! it was in fact really useful!

Dox gravatar imageDox ( 2015-08-24 21:40:48 +0100 )edit

^_^ .

tmonteil gravatar imagetmonteil ( 2017-04-11 04:31:37 +0100 )edit

Your Answer

Please start posting anonymously - your entry will be published after you log in or create a new account.

Add Answer

Question Tools

1 follower

Stats

Asked: 2015-08-20 21:17:53 +0100

Seen: 5,667 times

Last updated: Aug 22 '15