Revision history [back]
| | 1 | initial version |

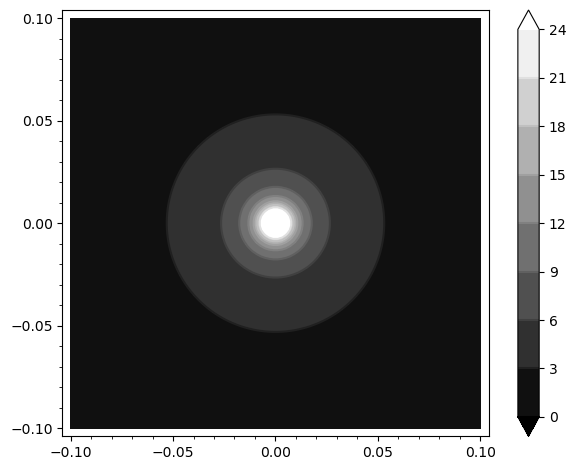
The plot_points argument affects the precision with which the plot is made; setting it low enough causes artifacts like circles appearing as squares. To get the image with those contours with more precision, you can omit the plot_points argument (or increase the value), and just pass the appropriate contours argument:
contour_plot(1/2/(pi*sqrt(x^2 + y^2)), (x, -0.1, 0.1), (y, -0.1, 0.1), contours=range(0,25,3), colorbar=True)