Revision history [back]
| | 1 | initial version |
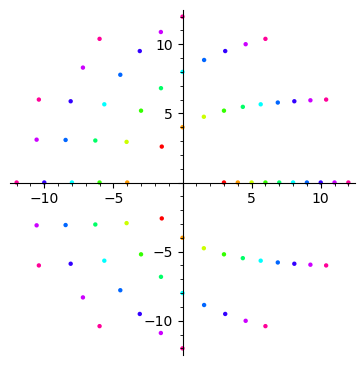
One way would be to use the hue.
Example:
sage: tau = 2*pi
sage: point_lists = [[(n*cos(k*tau/n), n*sin(k*tau/n)) for k in range(n)] for n in range(3, 13)]
sage: n = len(point_lists)
sage: G = sum(list_plot(point_list, hue=k/n) for k, point_list in enumerate(point_lists))
sage: G.show(aspect_ratio=1)
| | 2 | No.2 Revision |
One way would be to use the hue.
Example:
sage: tau = 2*pi
sage: point_lists ngon = [[(n*cos(k*tau/n), lambda n: [(n*cos(k*tau/n), n*sin(k*tau/n)) for k in range(n)] range(n)]
sage: point_lists = [ngon(n) for n in range(3, 13)]
sage: n = len(point_lists)
sage: G = sum(list_plot(point_list, hue=k/n) for k, point_list in enumerate(point_lists))
sage: G.show(aspect_ratio=1)
