Revision history [back]
| | 1 | initial version |
I typed "grid" in Ask Sage's "search or ask your question" box.
Some related questions and answers were suggested.
Many had useful tips and examples.
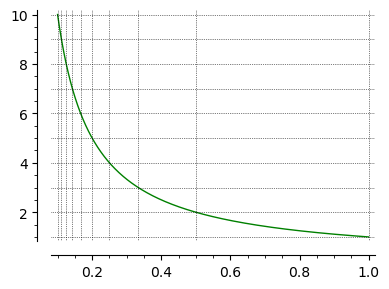
Instead of True, gridlines can be set to [xx, yy]
where xx and yy are gridlines coordinate lists.
Example:
sage: f = lambda x: 1/x
sage: plot(f, (0.1, 1), color='green', gridlines=[[1/n for n in (10, 9 .. 1)], [1 .. 10]])
| | 2 | No.2 Revision |
I typed "grid" in Ask Sage's "search or ask your question" box.
Some related questions and answers were suggested.
Many had useful tips and examples.
Instead of True, gridlines can be set to [xx, yy]
where xx and yy are gridlines coordinate lists.
Example:
sage: f = lambda x: 1/x
sage: plot(f, (0.1, 1), color='green', gridlines=[[1/n for n in (10, 9 .. 1)], [1 .. 10]])
To get a box around the picture, use frame=True.
