Revision history [back]
| | 1 | initial version |
One way is to set the figsize optional parameter in show to a large
value such as 20 or more. Indeed, some lengths (such as distances
between nodes) scale with the figsize whereas others (such as font size
and line thickness) don't.
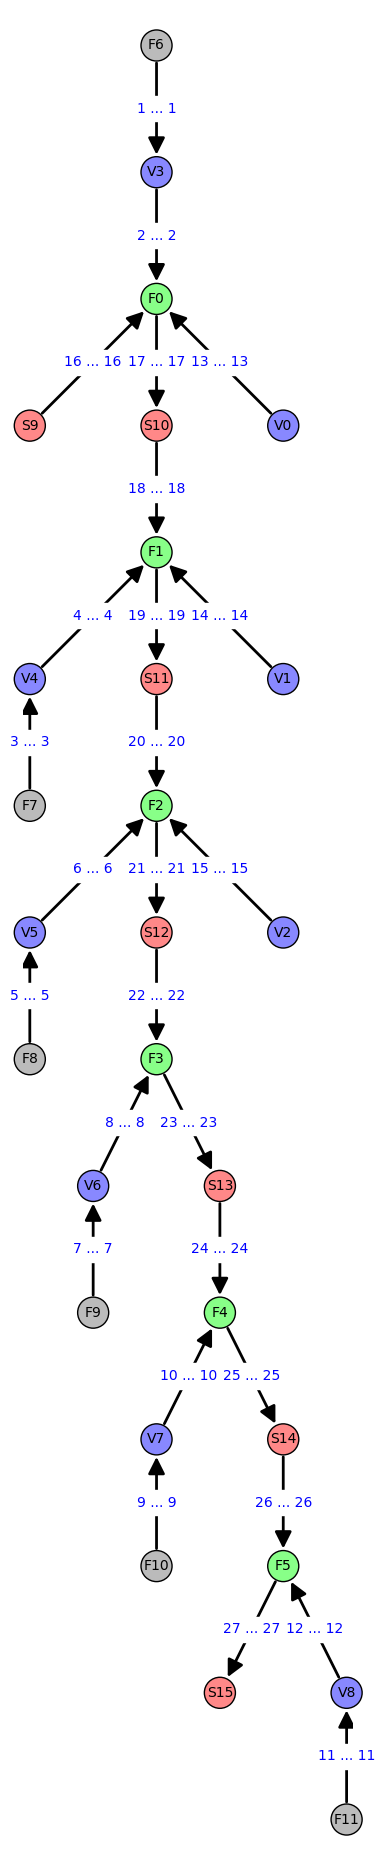
One can also play with the graph plotting algorithm; in this case, one could use 'tree' or 'planar' in addition to 'spring', and see if they result in better spread out vertices ('tree' is a good choice here).
Example:
msg_list =  [
    ('F6', 'V3'), ('V3', 'F0'), ('F7', 'V4'), ('V4', 'F1'),
    ('F8', 'V5'), ('V5', 'F2'), ('F9', 'V6'), ('V6', 'F3'),
    ('F10', 'V7'), ('V7', 'F4'), ('F11', 'V8'), ('V8', 'F5'),
    ('V0', 'F0'), ('V1', 'F1'), ('V2', 'F2'), ('S9', 'F0'),
    ('F0', 'S10'), ('S10', 'F1'), ('F1', 'S11'), ('S11', 'F2'),
    ('F2', 'S12'), ('S12', 'F3'), ('F3', 'S13'), ('S13', 'F4'),
    ('F4', 'S14'), ('S14', 'F5'), ('F5', 'S15')
]

c =  {
    '#BBBBBB': ['F6', 'F7', 'F8', 'F9', 'F10', 'F11'],
    '#8888FF': ['V0', 'V1', 'V2', 'V3', 'V4', 'V5', 'V6', 'V7', 'V8'],
    '#FF8888': ['S9', 'S10', 'S11', 'S12', 'S13', 'S14', 'S15'],
    '#88FF88': ['F0', 'F1', 'F2', 'F3', 'F4', 'F5']
}

G = DiGraph([], loops=False, multiedges=False)
msg_nr = 1

for v_from, v_to in msg_list:
    G.add_edge((v_from, v_to), label=f"{msg_nr} ... {msg_nr}")
    msg_nr += 1

opt = {'edge_labels': True, 'vertex_colors': c, 'vertex_size': 500}

p = G.plot(layout='planar', **opt)
p.show(figsize=25)

s = G.plot(layout='spring', **opt)
s.show(figsize=25)

t = G.plot(layout='tree', **opt)
t.show(figsize=25)
| | 2 | No.2 Revision |
One way is to set the figsize optional parameter in show to a large
value such as 20 or more. Indeed, some lengths (such as distances
between nodes) scale with the figsize figure size whereas others (such as as
font size
size and line thickness) don't.
One can also play with the graph plotting algorithm; in this case, one could use 'tree' or 'planar' in addition to 'spring', and see if they result in better spread out vertices ('tree' is a good choice here).
Example:
msg_list =  [
    ('F6', 'V3'), ('V3', 'F0'), ('F7', 'V4'), ('V4', 'F1'),
    ('F8', 'V5'), ('V5', 'F2'), ('F9', 'V6'), ('V6', 'F3'),
    ('F10', 'V7'), ('V7', 'F4'), ('F11', 'V8'), ('V8', 'F5'),
    ('V0', 'F0'), ('V1', 'F1'), ('V2', 'F2'), ('S9', 'F0'),
    ('F0', 'S10'), ('S10', 'F1'), ('F1', 'S11'), ('S11', 'F2'),
    ('F2', 'S12'), ('S12', 'F3'), ('F3', 'S13'), ('S13', 'F4'),
    ('F4', 'S14'), ('S14', 'F5'), ('F5', 'S15')
]

c =  {
    '#BBBBBB': ['F6', 'F7', 'F8', 'F9', 'F10', 'F11'],
    '#8888FF': ['V0', 'V1', 'V2', 'V3', 'V4', 'V5', 'V6', 'V7', 'V8'],
    '#FF8888': ['S9', 'S10', 'S11', 'S12', 'S13', 'S14', 'S15'],
    '#88FF88': ['F0', 'F1', 'F2', 'F3', 'F4', 'F5']
}

G = DiGraph([], loops=False, multiedges=False)
msg_nr = 1

for v_from, v_to in msg_list:
    G.add_edge((v_from, v_to), label=f"{msg_nr} ... {msg_nr}")
    msg_nr += 1

opt = {'edge_labels': True, 'vertex_colors': c, 'vertex_size': 500}

p = G.plot(layout='planar', **opt)
p.show(figsize=25)

s = G.plot(layout='spring', **opt)
s.show(figsize=25)

t = G.plot(layout='tree', **opt)
t.show(figsize=25)