Revision history [back]
| | 1 | initial version |

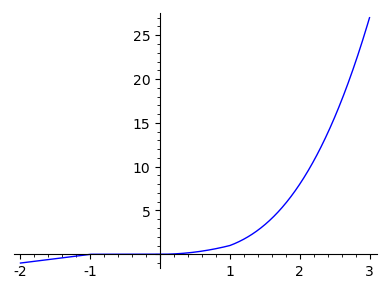
If your goal is to plot, then you only need a function that accepts numbers and returns numbers:
def f(x):
    if -2 <= x < -1:
        return x + 1
    elif -1 <= x < 0:
        return 0
    elif 0 <= x < 1:
        return x^2
    elif 1 <= x <= 3:
        return x^3
Indeed,
sage: plot(f,(-2,3))
Now, this function does not play well with symbolic variables:
sage: var('x')
sage: print(f(x))
None
It is because inequalities with symbolic variables only evaluate to True when Sage can prove them; here none of them can be proved because nothing is known about x. If you add assumptions then you can achieve something:
sage: assume(0<=x)
sage: assume(x<1)
sage: f(x)
x^2
But it does not help with plotting. The above explains why e.g. var('x'); plot(f(x),(x,2,3)) does not work.
You can have piecewise-defined symbolic functions in Sage, to some extent:
sage: var('x')
sage: f = piecewise([([-2,-1], x+1), ((-1,0), 0), ((0,1), x^2), ([1,3], x^3)])
sage: plot(f,(-2,3))
It gives the same plot. Now it is also possible to evaluate f(x) for symbolic x:
sage: f(x)
piecewise(x|-->x + 1 on [-2, -1], x|-->0 on (-1, 0), x|-->x^2 on (0, 1), x|-->x^3 on [1, 3]; x)
sage: plot(f(x),(x,-2,3))
Again, the same plot. This 'piecewise' functionality is unfortunately somewhat fragile, e.g. diff(f,x) returns junk.
| | 2 | No.2 Revision |
If your goal is to plot, then you only need a function that accepts numbers and returns numbers:
def f(x):
    if -2 <= x < -1:
        return x + 1
    elif -1 <= x < 0:
        return 0
    elif 0 <= x < 1:
        return x^2
    elif 1 <= x <= 3:
        return x^3
Indeed,
sage: plot(f,(-2,3))
Now, this function does not play well with symbolic variables:
sage: var('x')
sage: print(f(x))
None
It is because inequalities with symbolic variables only evaluate to True when Sage can prove them; here none of them can be proved because nothing is known about x. If you add assumptions then you can achieve something:
sage: assume(0<=x)
sage: assume(x<1)
sage: f(x)
x^2
But it does not help with plotting. The above explains why e.g. var('x'); plot(f(x),(x,2,3)) does not work.
You can have univariate piecewise-defined symbolic functions in Sage, to some extent:
sage: var('x')
sage: f = piecewise([([-2,-1], x+1), ((-1,0), 0), ((0,1), x^2), ([1,3], x^3)])
sage: plot(f,(-2,3))
It gives the same plot. Now it is also possible to evaluate f(x) for symbolic x:
sage: f(x)
piecewise(x|-->x + 1 on [-2, -1], x|-->0 on (-1, 0), x|-->x^2 on (0, 1), x|-->x^3 on [1, 3]; x)
sage: plot(f(x),(x,-2,3))
Again, the same plot. This 'piecewise' functionality is unfortunately somewhat fragile, e.g. diff(f,x) returns junk.
To plot a surface with a piecewise parametrization, avoid symbolic variables:
def g(x,y):
    if x >= y:
        return x
    else:
        return y

parametric_plot3d([lambda x,y: x, lambda x,y: y, g], (-1,1), (-1,1))
| | 3 | No.3 Revision |
If your goal is to plot, then you only need a function that accepts numbers and returns numbers:
def f(x):
    if -2 <= x < -1:
        return x + 1
    elif -1 <= x < 0:
        return 0
    elif 0 <= x < 1:
        return x^2
    elif 1 <= x <= 3:
        return x^3
Indeed,
sage: plot(f,(-2,3))
Now, this function does not play well with symbolic variables:
sage: var('x')
sage: print(f(x))
None
It is because inequalities with symbolic variables only evaluate to True when Sage can prove them; here none of them can be proved because nothing is known about x. If you add assumptions then you can achieve something:
sage: assume(0<=x)
sage: assume(x<1)
sage: f(x)
x^2
But it does not help with plotting. The above explains why e.g. var('x'); plot(f(x),(x,2,3)) does not work.
You can have univariate piecewise-defined symbolic functions in Sage, to some extent:
sage: var('x')
sage: f = piecewise([([-2,-1], x+1), ((-1,0), 0), ((0,1), x^2), ([1,3], x^3)])
sage: plot(f,(-2,3))
It gives the same plot. Now it is also possible to evaluate f(x) for symbolic x:
sage: f(x)
piecewise(x|-->x + 1 on [-2, -1], x|-->0 on (-1, 0), x|-->x^2 on (0, 1), x|-->x^3 on [1, 3]; x)
sage: plot(f(x),(x,-2,3))
Again, the same plot. This 'piecewise' functionality is unfortunately somewhat fragile, e.g. diff(f,x) returns junk.
To plot a surface with a piecewise parametrization, avoid symbolic variables:
def g(x,y):
    if x >= y:
        return x
    else:
        return y

parametric_plot3d([lambda x,y: x, lambda x,y: y, g], (-1,1), (-1,1))
Your surface:
x_3, y_3 = 1/3, 1/4

def X(u,v):
    return u
def Y(u,v):
    return v
def Z(u,v):
    if 1-u-v <= 0 or u <= 0 or v <= 0: # when P=(u,v) is outside of B or lies on its boundary
        return 0
    else: # i.e., exactly when P lies in the interior of B
        return exp(-((u-x_3)^2+(v-y_3)^2)/((1-u-v)^2*(u^2)*(v^2)))

print(Z(x_3,y_3))
parametric_plot3d([X,Y,Z], (x_3-0.1,x_3+0.1), (y_3-0.1,y_3+0.1), plot_points=[200,200], viewer='threejs')
parametric_plot3d([X,Y,Z], (-2,2), (-2,2), plot_points=[200,200], viewer='threejs')
