Revision history [back]
 | 1 | initial version |
I fiddled around and got it to work by changing the legend_label:
var("x_1","x_2")
eq1=solve(3*x_1+4*x_2==14,x_2)
eq2=solve(5*x_1+6*x_2==-8,x_2)
eq3=solve(4*x_1-7*x_2==18,x_2)
eq4=solve(2*x_1-3*x_2==-8,x_2)
b=10
p=plot([eq1[0].rhs(),eq2[0].rhs(),eq3[0].rhs(),eq4[0].rhs()], (x_1, 0,b),color=["#c72b91","#2b37c7", "#cb7b2b","#2bcb4b"],axes_labels=["$x_1$","$x_2$"],legend_label=[r"$%s$"%latex(eq1[0].rhs()),r"$%s$"%latex(eq2[0].rhs()),r"$%s$"%latex(eq3[0].rhs()),r"$%s$"%latex(eq4[0].rhs())])
show(p)
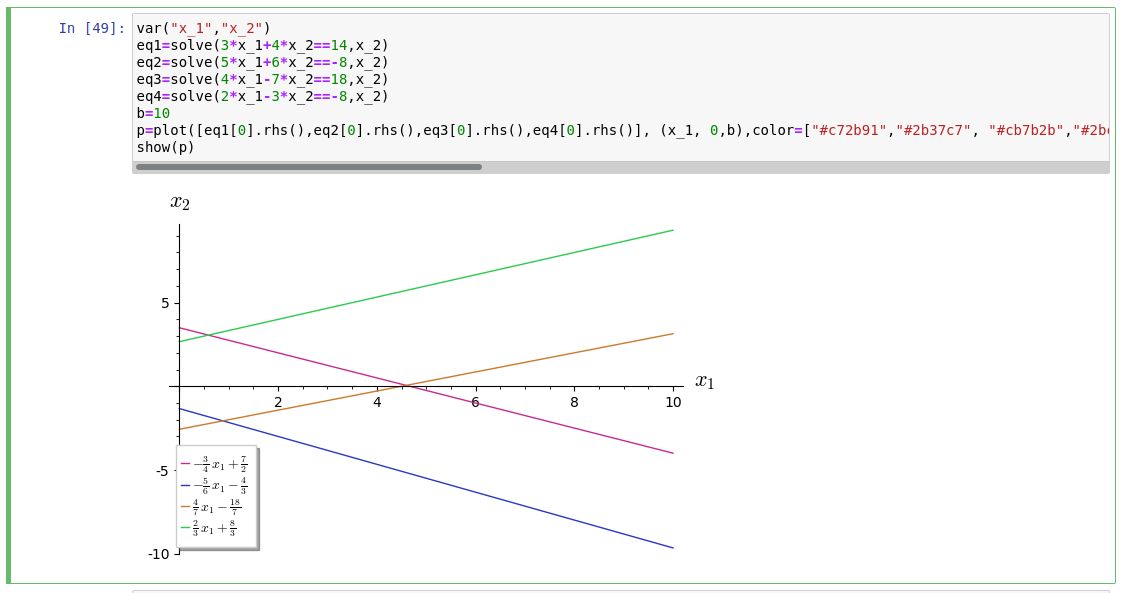
This is the result:

Since there are several equations in the legend, I use a list. Looking at that part of the code,
r"$%s$"%latex(eq1[0].rhs()) accomplishes the task by first getting the latex code for eq1[0].rhs() with latex(eq1[0].rhs()) followed by inserting that in for the string r"$%s$. The r is for a raw string and since its a formula, LaTeX needs it between dollar signs.
 | 2 | No.2 Revision |
I fiddled around and got it to work by changing the legend_label:
var("x_1","x_2")
eq1=solve(3*x_1+4*x_2==14,x_2)
eq2=solve(5*x_1+6*x_2==-8,x_2)
eq3=solve(4*x_1-7*x_2==18,x_2)
eq4=solve(2*x_1-3*x_2==-8,x_2)
b=10
p=plot([eq1[0].rhs(),eq2[0].rhs(),eq3[0].rhs(),eq4[0].rhs()], (x_1, 0,b),color=["#c72b91","#2b37c7", "#cb7b2b","#2bcb4b"],axes_labels=["$x_1$","$x_2$"],legend_label=[r"$%s$"%latex(eq1[0].rhs()),r"$%s$"%latex(eq2[0].rhs()),r"$%s$"%latex(eq3[0].rhs()),r"$%s$"%latex(eq4[0].rhs())])
show(p)
This is the result:

Since there are several equations in the legend, I use a list. Looking at that part of the code,
r"$%s$"%latex(eq1[0].rhs()) accomplishes the task by first getting the latex code for eq1[0].rhs() with latex(eq1[0].rhs()) followed by inserting that in for the string r"$%s$. The r is for a raw string and since its a formula, LaTeX needs it between dollar signs.
It seems a bit awkward, maybe others have a more efficient way.
