Revision history [back]
| | 1 | initial version |
This is more a comment than an answer, posted as an answer since it is too long to fit in a comment.
I do not observe (or do not understand) the problem (on macOS with Sage 9.2.beta12 built from source).
Below a slightly rewritten form of the code from the question, with pictures. (The original code gives me the same pictures.)
- If you get the same pictures, say what the problem is with them.
- If not, upload yours and say what version of Sage you are using.
If posting an image on Ask Sage is too tedious, there are various other ways to do that:
- put the code on SageCell, get a link and post it here
- put the code on CoCalc, share it, post the link here
- upload a Jupyter worksheet somewhere, link to it here
Below I am adding sectioning to make it easy to ask any question relating to a specific part of my answer (or the corresponding part in the question).
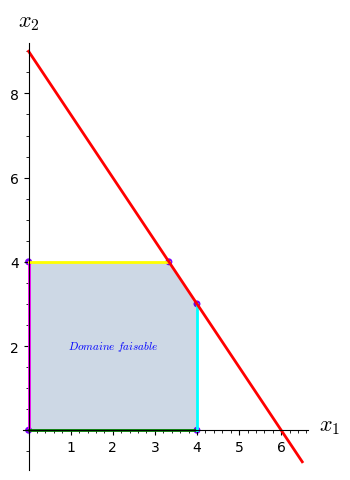
0.
0.0.
Define graphic options for the various graphics objects.
sage: options_plot = {'axes_labels': ['$x_1$','$x_2$'], 'thickness': 2, 'zorder': 2}
sage: options_line = {'thickness': 2}
sage: options_point = {'pointsize': 25, 'rgbcolor': hue(0.75),
....:                  'aspect_ratio': 'automatic', 'zorder': 1}
sage: options_pol = {'rgbcolor': (0.025, 0.25, 0.5), 'alpha': 0.2}
0.1.
A function and its plot.
sage: f1 = lambda x: 9 - (3/2)*x
sage: p1 = plot(f1, (0, 6.5), color='red', **options_plot)
0.2.
Four lines.
sage: l0 = line([(0, 0), (0, 4)], color='magenta', **options_line)
sage: l1 = line([(0, 4), (10/3, 4)], color='yellow', **options_line)
sage: l2 = line([(0, 0), (4, 0)], color='green', **options_line)
sage: l3 = line([(4, 0), (4, 3)], color='cyan', **options_line)
0.3.
Five corners.
sage: c1 = point((0, 0), **options_point)
sage: c2 = point((0, 4), **options_point)
sage: c3 = point((4, 0), **options_point)
sage: c4 = point((10/3, 4), **options_point)
sage: c5 = point((4, 3), **options_point)
0.4.
One polygon.
sage: pol = polygon([(0, 0), (0, 4), (10/3, 4), (4, 3), (4, 0)], **options_pol)
0.5.
A text description, and a graphics with all these elements.
sage: D = text(r"$Domaine\,\, faisable$", (2, 2), fontsize=8)
sage: G = sum([pol, l0, l1, l2, l3, p1, c1, c2, c3, c4, c5], D)
0.6
Save the picture to a file.
sage: G.save('ask_53468_G.png')
0.7.
Show the whole picture.
sage: G.show()
Launched png viewer for Graphics object consisting of 12 graphics primitives
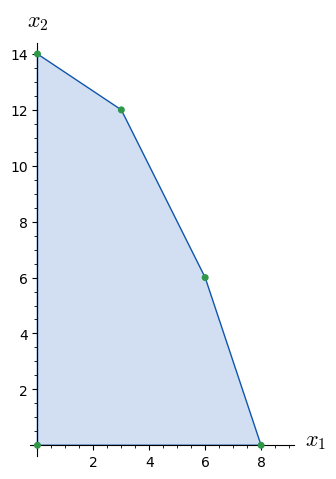
1.
1.0.
A list of inequalities and the corresponding polygon.
sage: ieqs1 = [(18, -2, -1), (42, -2, -3), (24, -3, -1), (0, 1, 0), (0, 0, 1)]
sage: pol1 = Polyhedron(ieqs=ieqs1)
1.1.
Turn the polygon vertices into tuples.
sage: S = [s for s in pol1.Vrepresentation()]
sage: SS = [tuple(s) for s in S]
1.2.
Small circles around the vertices.
sage: options_circle = {'fill': True, 'edgecolor': '#2f974a', 'facecolor': '#2f974a'}
sage: C = [circle(s, .1, **options_circle) for s in SS]
sage: PC = [plot(c) for c in C]
1.3.
The polygon as a graphics object.
sage: gon = polygon(SS, fill=True, color='#d2def1', edgecolor="#0e56ad")
1.4.
The constant zero function and its plot.
sage: z = lambda x: 0
sage: lab = plot(z, (0, 9), color='black', axes_labels=['$x_1$', '$x_2$'], thickness=0.0001)
1.5.
Everything in one graphics object.
sage: GG = sum(PC, lab + gon)
1.6.
Save the picture.
sage: GG.save('ask_53468_GG.png')
1.7.
Show the whole picture.
sage: GG.show()
Launched png viewer for Graphics object consisting of 7 graphics primitives