Revision history [back]
| | 1 | initial version |
Here is some sample code which should do what you want:
entPlot = prod+lom+savings

# compute intersection points
intersectionX = solve(delta*k == invest, k, to_poly_solve=True)[1].rhs()
intersectionY = invest(intersectionX)

# define all plot elements
linesPlot = line([(intersectionX,0), (intersectionX,intersectionY)], color="purple", linestyle="--")
linesPlot += line([(0,intersectionY), (intersectionX,intersectionY)], color="purple", linestyle="--")
txtPointIntersection = "(" + str(n(intersectionX, digits=5)) + " | " + str(n(intersectionY, digits=5)) + ")"
textPlot = text(txtPointIntersection, (intersectionX + 2, intersectionY - 1), color="purple", horizontal_alignment="left")

show(entPlot + linesPlot + textPlot)
For references: On how to plot lines, e.g. https://ask.sagemath.org/question/38630/how-to-plot-vertical-lines/ On how to plot and which options where are to pretty up your plots (you should just try around with the options you see there): https://doc.sagemath.org/html/en/reference/plotting/sage/plot/plot.html
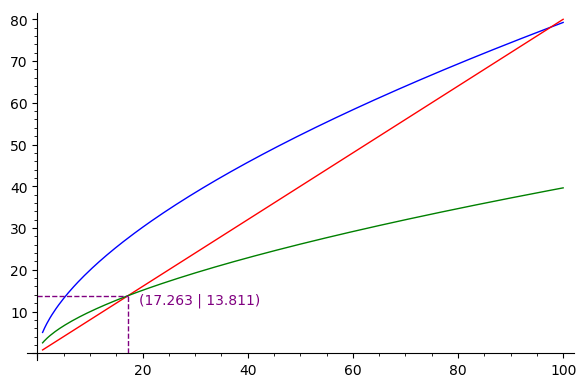
Output of the code from above:
| | 2 | No.2 Revision |
Here is some sample code which should do what you want:
entPlot = prod+lom+savings

# compute intersection points
intersectionX intX = solve(delta*k == invest, k, to_poly_solve=True)[1].rhs()
intersectionY intY = invest(intersectionX)
invest(intX)

# define all plot elements
linesPlot = line([(intersectionX,0), (intersectionX,intersectionY)], line([(intX,0), (intX,intY)], color="purple", linestyle="--")
linesPlot += line([(0,intersectionY), (intersectionX,intersectionY)], (intX,intY)], color="purple", linestyle="--")
txtPointIntersection txtPointInt = "(" + str(n(intersectionX, str(n(intX, digits=5)) + " | " + str(n(intersectionY, digits=5)) + ")"
textPlot = text(txtPointIntersection, (intersectionX text(txtPointInt, (intX + 2, intersectionY intY - 1), color="purple", horizontal_alignment="left")

show(entPlot + linesPlot + textPlot)
For references: On how to plot lines, e.g. https://ask.sagemath.org/question/38630/how-to-plot-vertical-lines/ On how to plot and which options where are to pretty up your plots (you should just try around with the options you see there): https://doc.sagemath.org/html/en/reference/plotting/sage/plot/plot.html
Output of the code from above:
| | 3 | No.3 Revision |
Here is some sample code which should do what you want:
entPlot = prod+lom+savings

# compute intersection points
intX = solve(delta*k == invest, k, to_poly_solve=True)[1].rhs()
intY = invest(intX)

# define all plot elements
linesPlot = line([(intX,0), (intX,intY)], color="purple", linestyle="--")
linesPlot += line([(0,intersectionY), (intX,intY)], color="purple", linestyle="--")
txtPointInt = "(" + str(n(intX, digits=5)) + " | " + str(n(intersectionY, str(n(intY, digits=5)) + ")"
textPlot = text(txtPointInt, (intX + 2, intY - 1), color="purple", horizontal_alignment="left")

show(entPlot + linesPlot + textPlot)
For references: On how to plot lines, e.g. https://ask.sagemath.org/question/38630/how-to-plot-vertical-lines/ On how to plot and which options where are to pretty up your plots (you should just try around with the options you see there): https://doc.sagemath.org/html/en/reference/plotting/sage/plot/plot.html
Output of the code from above:
