Revision history [back]
| | 1 | initial version |
Instead of plot_vector_field3d, use the method plot of vector fields:
vf.plot(chart=c_cart, chart_domain=c_spher, ranges={r: (2, 10)}, scale=0.2, width=2)
The output is
See the documentation of VectorField.plot() for explanations and more examples.
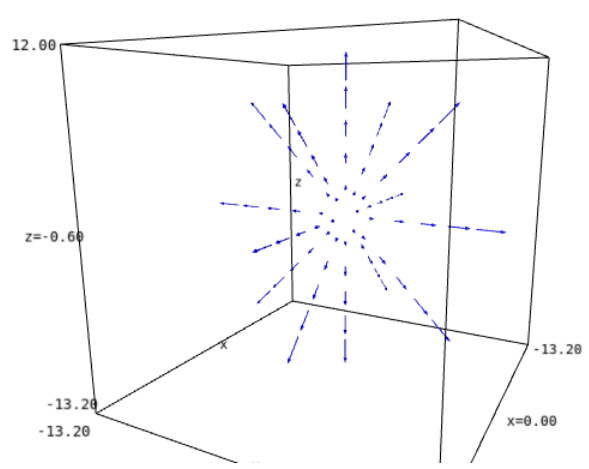
| | 2 | No.2 Revision |
Instead of plot_vector_field3d, use the method plot of vector fields:
vf.plot(chart=c_cart, chart_domain=c_spher, ranges={r: (2, 10)}, scale=0.2, width=2)
The output is
See the documentation of VectorField.plot() for explanations and more examples.
Side note: there are some typos in your example (E.vectorfield --> E.vector_field, cart --> chart); it should read
vf = E.vector_field((r,0,0), frame=f_spher, chart=c_spher, name="vf")
Besides, instead of f_spher = E.frames()[2], you can use f_spher = E.spherical_frame().
